
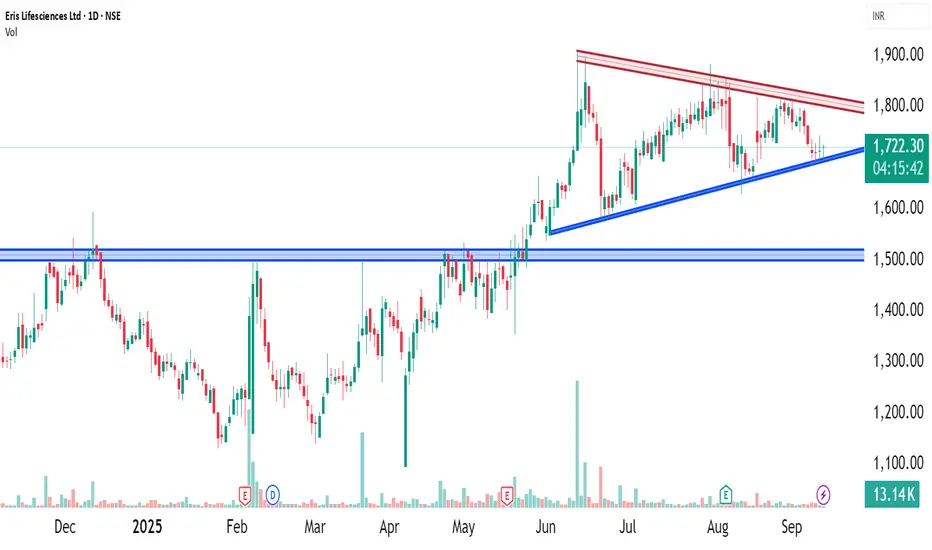
Eris Lifesciences Ltd. is currently exhibiting a Symmetrical Triangle Pattern on its daily chart. This pattern is characterized by converging trendlines formed by lower highs and higher lows, indicating a period of consolidation. While symmetrical triangles often serve as continuation patterns, they can also signal potential reversals, depending on the breakout direction.
The pattern's apex is approaching, suggesting that a breakout—either upward or downward—is imminent. It's crucial to monitor the breakout closely, as the direction will determine the subsequent trading strategy.
📉 RSI Analysis: Indicating Sideways Momentum
The RSI for Eris Lifesciences is currently below 50, indicating a neutral to bearish momentum. This suggests that the stock is in a sideways trend, with neither bulls nor bears gaining a clear advantage. Such conditions are typical during consolidation phases, reinforcing the current symmetrical triangle pattern.
🕯️ Candlestick Insight: Doji Formation
Recently, multiple doji candlestick with long legs has formed, signaling indecision in the market. A Doji occurs when the opening and closing prices are nearly identical, reflecting a balance between buying and selling pressures. The long wicks indicate that both bulls and bears attempted to take control but failed, leaving the market in a state of equilibrium.
This formation suggests that significant market participants are awaiting a catalyst to drive the next move, making it a critical point to observe for potential breakout confirmation.
🧠 Strategic Outlook: Awaiting Breakout Confirmation
Given the current technical indicators—a symmetrical triangle pattern, neutral RSI, and a doji candlestick—it's prudent to adopt a wait-and-see approach. The next significant move will depend on the breakout direction from the triangle:
In both scenarios, it's essential to wait for confirmation through volume and momentum indicators before entering a position.
📌 Conclusion
Eris Lifesciences Ltd. is at a pivotal juncture. The formation of a symmetrical triangle, coupled with a neutral RSI and a doji candlestick, points to a period of consolidation. Traders should remain vigilant for a breakout in either direction, using volume and momentum indicators to confirm the move before making trading decisions.
As always, it's advisable to conduct thorough research and consider consulting with a financial advisor before making any investment decisions.
The pattern's apex is approaching, suggesting that a breakout—either upward or downward—is imminent. It's crucial to monitor the breakout closely, as the direction will determine the subsequent trading strategy.
📉 RSI Analysis: Indicating Sideways Momentum
The RSI for Eris Lifesciences is currently below 50, indicating a neutral to bearish momentum. This suggests that the stock is in a sideways trend, with neither bulls nor bears gaining a clear advantage. Such conditions are typical during consolidation phases, reinforcing the current symmetrical triangle pattern.
🕯️ Candlestick Insight: Doji Formation
Recently, multiple doji candlestick with long legs has formed, signaling indecision in the market. A Doji occurs when the opening and closing prices are nearly identical, reflecting a balance between buying and selling pressures. The long wicks indicate that both bulls and bears attempted to take control but failed, leaving the market in a state of equilibrium.
This formation suggests that significant market participants are awaiting a catalyst to drive the next move, making it a critical point to observe for potential breakout confirmation.
🧠 Strategic Outlook: Awaiting Breakout Confirmation
Given the current technical indicators—a symmetrical triangle pattern, neutral RSI, and a doji candlestick—it's prudent to adopt a wait-and-see approach. The next significant move will depend on the breakout direction from the triangle:
- Bullish Scenario: A breakout above the upper trendline, accompanied by increased volume and a rising RSI, would suggest a continuation of the uptrend.
- Bearish Scenario: Conversely, a breakdown below the lower trendline, with declining volume and a falling RSI, would indicate a potential reversal to the downside.
In both scenarios, it's essential to wait for confirmation through volume and momentum indicators before entering a position.
📌 Conclusion
Eris Lifesciences Ltd. is at a pivotal juncture. The formation of a symmetrical triangle, coupled with a neutral RSI and a doji candlestick, points to a period of consolidation. Traders should remain vigilant for a breakout in either direction, using volume and momentum indicators to confirm the move before making trading decisions.
As always, it's advisable to conduct thorough research and consider consulting with a financial advisor before making any investment decisions.

คำจำกัดสิทธิ์ความรับผิดชอบ
ข้อมูลและบทความไม่ได้มีวัตถุประสงค์เพื่อก่อให้เกิดกิจกรรมทางการเงิน, การลงทุน, การซื้อขาย, ข้อเสนอแนะ หรือคำแนะนำประเภทอื่น ๆ ที่ให้หรือรับรองโดย TradingView อ่านเพิ่มเติมใน ข้อกำหนดการใช้งาน
คำจำกัดสิทธิ์ความรับผิดชอบ
ข้อมูลและบทความไม่ได้มีวัตถุประสงค์เพื่อก่อให้เกิดกิจกรรมทางการเงิน, การลงทุน, การซื้อขาย, ข้อเสนอแนะ หรือคำแนะนำประเภทอื่น ๆ ที่ให้หรือรับรองโดย TradingView อ่านเพิ่มเติมใน ข้อกำหนดการใช้งาน