
Decoding Yields: How the 10-Year Runs the Market
If you only watch one number on your screen, make it TVC:US10Y.
It's sitting around 5.2% as of late September 2026, the highest since 2007. Most traders see that and think "bonds, not my market." That's a mistake, because almost everything else you trade is priced off it.
THE BASICS
When you buy a Treasury, you're lending money to the U.S. government. You get interest (the yield) and your principal back at maturity. Prices and yields move in opposite directions: when people sell bonds, yields rise. A fast, sustained climb usually means investors want more compensation for holding long-term U.S. debt, whether from inflation worries, fiscal concerns, or better options elsewhere.
That's why the 10-year is called the risk-free rate. If the safest borrower on Earth pays 5.2%, everyone riskier (homebuyers, corporations, small businesses) has to pay more. Even this number carries inflation risk and duration risk, but it's still the reference point everything else gets measured against.
SHORT END VS. LONG END
The curve has two personalities.
The short end (bills up to about 3 years) follows the Fed closely. The 2-year, TVC:US02Y, is the one to watch. It's the market's live vote on where policy is heading:
The long end (10-year and 30-year, TVC:US30Y) belongs to the open market. Thousands of investors are weighing growth, inflation and confidence in U.S. fiscal policy. That's how you get long yields rising while the Fed is cutting, or falling while the Fed sits still.
One handy tool here is the breakeven rate. Subtract the TIPS (real) yield from the nominal yield of the same maturity and you get the market's implied inflation forecast. The 5-year breakeven is the standard benchmark.
WHAT THE CURVE SHAPE IS TELLING YOU
The spreads people track are 2s10s, 3m10y and 2s30s. The strongest signal comes when all three agree.
Inversions aren't only a forecast, they're part of the mechanism too. Banks borrow short and lend long, so an inverted curve squeezes their net interest margin. Lending gets less profitable, credit standards tighten, and that helps cause the slowdown the curve was predicting.
One nuance worth keeping in mind: bull steepening (short yields falling faster, usually because the Fed is cutting) and bear steepening (long yields rising faster, often on inflation or fiscal fears) look identical on a chart. They mean very different things for what comes next.
HOW A BOND NUMBER BECOMES REAL-WORLD PAIN
Mortgages. Lenders won't write a 30-year loan at 4% when they can earn about 5.2% in Treasuries with basically no risk, so mortgage rates sit above Treasury yields. On a $400k loan:
It also freezes the market. Homeowners with 3% mortgages don't want to sell and take a 7% one, so inventory dries up.
Corporate debt. Companies borrow at Treasuries plus a credit spread. A firm that borrowed at 4% might now face 7% to 9%. Higher cost of capital means delayed projects, slower hiring, thinner profits, and real trouble for anyone with variable-rate debt or a near-term refinancing wall.
Stocks. Say $1M sits in the 10-year. At 4% that's $40k a year. At 5.2% it's $52k a year, risk-free. Every extra point of "safe" return raises the bar stocks have to clear. A company can post the exact earnings everyone expected and still fall, simply because investors won't pay the same multiple anymore. That's a discount-rate re-rating, no earnings collapse needed.
It matters more when valuations are already stretched. Composite valuation measures (CAPE, price-to-sales, market cap to GDP and others) have pushed U.S. equities near the richest levels in over a century, comparable to 1929 and 2000. Expensive doesn't mean a crash is guaranteed, but there's less room for error.
Dollar and capital flows. Higher U.S. yields pull in foreign capital and strengthen the dollar (TVC:DXY). Falling yields can send money looking for yield elsewhere.
THE AMPLIFIERS
Rate shocks rarely happen alone. Right now the big one is oil. The Iran conflict has repeatedly disrupted energy markets, with crude trading above $100 for extended stretches and Brent hovering near it. Oil feeds into transport, manufacturing, agriculture and shipping, and eventually into consumer prices.
The loop looks like this:
Geopolitical shock → oil spike → inflation → Fed stays tight → yields stay high → mortgages, credit and stocks all feel it at once
Two more amplifiers sit on top:
FROM SHOCK TO RECESSION
The pressure doesn't arrive in a neat sequence. It hits consumers, companies and markets at the same time. A recession forms when these channels compound:
The reverse works too. When the U.S. and Iran paused strikes in July, oil fell and yields moved lower with it, easing pressure everywhere. Where we go from here depends largely on whether that de-escalation holds.
KEY TAKEAWAYS
I think of the 10-year like a thermostat for the whole economy. It won't tell you what the weather is outside, but it shows how much pressure every borrower and every valuation model is under right now. A steady, gentle climb is normal. A fast, sustained spike usually means cracks are about to show, well before anyone calls it a recession.
What's your read: does the de-escalation hold, or does the chain keep tightening? Let me know in the comments.
Not financial advice. Educational purposes only.
If you only watch one number on your screen, make it TVC:US10Y.
It's sitting around 5.2% as of late September 2026, the highest since 2007. Most traders see that and think "bonds, not my market." That's a mistake, because almost everything else you trade is priced off it.
THE BASICS
When you buy a Treasury, you're lending money to the U.S. government. You get interest (the yield) and your principal back at maturity. Prices and yields move in opposite directions: when people sell bonds, yields rise. A fast, sustained climb usually means investors want more compensation for holding long-term U.S. debt, whether from inflation worries, fiscal concerns, or better options elsewhere.
That's why the 10-year is called the risk-free rate. If the safest borrower on Earth pays 5.2%, everyone riskier (homebuyers, corporations, small businesses) has to pay more. Even this number carries inflation risk and duration risk, but it's still the reference point everything else gets measured against.
SHORT END VS. LONG END
The curve has two personalities.
The short end (bills up to about 3 years) follows the Fed closely. The 2-year, TVC:US02Y, is the one to watch. It's the market's live vote on where policy is heading:
- A rising 2-year while the Fed is hiking = the market expects more tightening
- A falling 2-year while the Fed holds = traders think cuts are coming sooner than the Fed admits
The long end (10-year and 30-year, TVC:US30Y) belongs to the open market. Thousands of investors are weighing growth, inflation and confidence in U.S. fiscal policy. That's how you get long yields rising while the Fed is cutting, or falling while the Fed sits still.
One handy tool here is the breakeven rate. Subtract the TIPS (real) yield from the nominal yield of the same maturity and you get the market's implied inflation forecast. The 5-year breakeven is the standard benchmark.
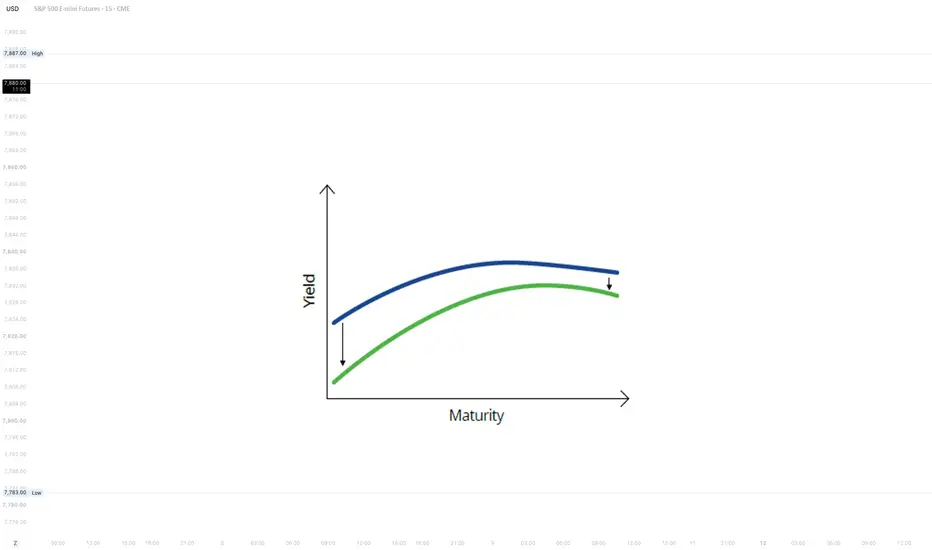
WHAT THE CURVE SHAPE IS TELLING YOU
- Normal: longer maturities pay more
- Flat: short and long yields have converged, often a transition phase
- Inverted: short yields above long yields. This has preceded every U.S. recession since the 1950s, typically by 6 to 24 months
The spreads people track are 2s10s, 3m10y and 2s30s. The strongest signal comes when all three agree.
Inversions aren't only a forecast, they're part of the mechanism too. Banks borrow short and lend long, so an inverted curve squeezes their net interest margin. Lending gets less profitable, credit standards tighten, and that helps cause the slowdown the curve was predicting.
One nuance worth keeping in mind: bull steepening (short yields falling faster, usually because the Fed is cutting) and bear steepening (long yields rising faster, often on inflation or fiscal fears) look identical on a chart. They mean very different things for what comes next.
HOW A BOND NUMBER BECOMES REAL-WORLD PAIN
Mortgages. Lenders won't write a 30-year loan at 4% when they can earn about 5.2% in Treasuries with basically no risk, so mortgage rates sit above Treasury yields. On a $400k loan:
- At 3%: about $1,686 a month
- At 7%: about $2,661 a month
- The gap: $975 more every month and roughly $350k more in lifetime interest
It also freezes the market. Homeowners with 3% mortgages don't want to sell and take a 7% one, so inventory dries up.
Corporate debt. Companies borrow at Treasuries plus a credit spread. A firm that borrowed at 4% might now face 7% to 9%. Higher cost of capital means delayed projects, slower hiring, thinner profits, and real trouble for anyone with variable-rate debt or a near-term refinancing wall.
Stocks. Say $1M sits in the 10-year. At 4% that's $40k a year. At 5.2% it's $52k a year, risk-free. Every extra point of "safe" return raises the bar stocks have to clear. A company can post the exact earnings everyone expected and still fall, simply because investors won't pay the same multiple anymore. That's a discount-rate re-rating, no earnings collapse needed.
It matters more when valuations are already stretched. Composite valuation measures (CAPE, price-to-sales, market cap to GDP and others) have pushed U.S. equities near the richest levels in over a century, comparable to 1929 and 2000. Expensive doesn't mean a crash is guaranteed, but there's less room for error.
Dollar and capital flows. Higher U.S. yields pull in foreign capital and strengthen the dollar (TVC:DXY). Falling yields can send money looking for yield elsewhere.
THE AMPLIFIERS
Rate shocks rarely happen alone. Right now the big one is oil. The Iran conflict has repeatedly disrupted energy markets, with crude trading above $100 for extended stretches and Brent hovering near it. Oil feeds into transport, manufacturing, agriculture and shipping, and eventually into consumer prices.
The loop looks like this:
Geopolitical shock → oil spike → inflation → Fed stays tight → yields stay high → mortgages, credit and stocks all feel it at once
Two more amplifiers sit on top:
- Deficits and supply: more Treasury issuance pushes prices down and yields up
- Foreign demand: if big holders like Japan or China pull back, the market needs new buyers at higher yields
FROM SHOCK TO RECESSION
The pressure doesn't arrive in a neat sequence. It hits consumers, companies and markets at the same time. A recession forms when these channels compound:
- Demand destruction: higher payments, less spending elsewhere
- Investment freeze: capex and hiring stop clearing the cost-of-capital bar
- Reverse wealth effect: falling portfolios, cautious households
- Credit stress: downgrades and defaults among leveraged or refinancing-exposed firms
- Self-reinforcing slowdown: weaker hiring, weaker spending, weaker revenue, more layoffs
The reverse works too. When the U.S. and Iran paused strikes in July, oil fell and yields moved lower with it, easing pressure everywhere. Where we go from here depends largely on whether that de-escalation holds.
KEY TAKEAWAYS
- The 10-year is the base rate everything else is priced against
- The short end tracks the Fed, the long end tracks the market's view of growth and inflation
- Inversions have preceded every U.S. recession since the 1950s, and they squeeze bank lending too
- Stocks can drop on valuation alone when the discount rate rises into an expensive market
- Oil, inflation, deficits and foreign demand are the classic amplifiers
- A recession isn't caused by the yield itself. It comes from mortgages, credit and valuations getting squeezed all at once
I think of the 10-year like a thermostat for the whole economy. It won't tell you what the weather is outside, but it shows how much pressure every borrower and every valuation model is under right now. A steady, gentle climb is normal. A fast, sustained spike usually means cracks are about to show, well before anyone calls it a recession.
What's your read: does the de-escalation hold, or does the chain keep tightening? Let me know in the comments.
Not financial advice. Educational purposes only.

🔵 Tools that give you the edge: candelacharts.com/.
🔵 Join our free discord for updates: candelacharts.com/community
🔵 Join our free discord for updates: candelacharts.com/community
คำจำกัดสิทธิ์ความรับผิดชอบ
ข้อมูลและบทความไม่ได้มีวัตถุประสงค์เพื่อก่อให้เกิดกิจกรรมทางการเงิน, การลงทุน, การซื้อขาย, ข้อเสนอแนะ หรือคำแนะนำประเภทอื่น ๆ ที่ให้หรือรับรองโดย TradingView อ่านเพิ่มเติมใน ข้อกำหนดการใช้งาน