
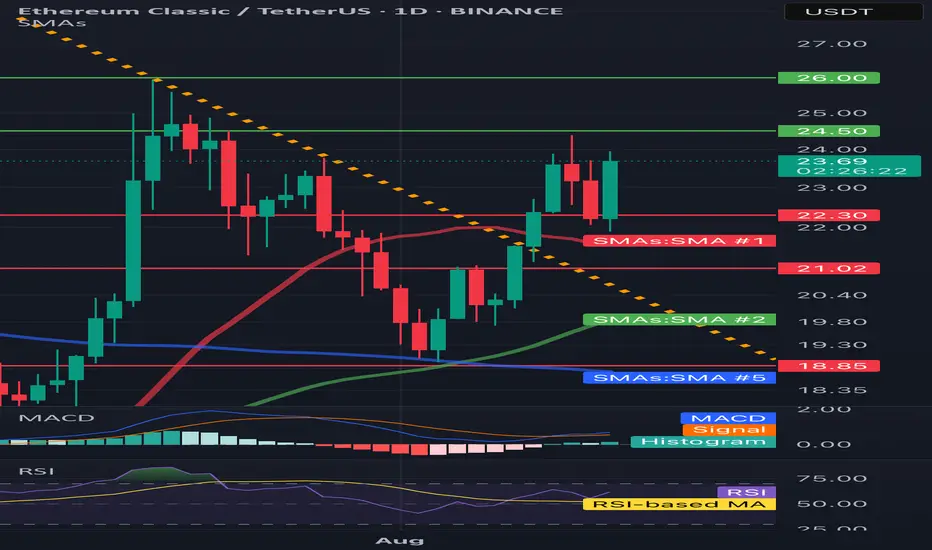
1. Trend and price structure
• The price is currently 23.71 USDT (+6.75% on the day).
• After an earlier inheritance trend (yellow dotted line - trend line), you can see an attempt to break up and maintain above SMA 1 (approx. 22.30 USDT).
• The next resistance is 24.50 and 26.00 USDT - you can see that the supply of supply was already 24.50.
• The next support is 22.30 and stronger at 21.02 USDT.
2. Medium walking (SMA)
• SMA #1 (red) - short -term, the price is above, which is a bull signal.
• SMA #2 (green) - medium -term, also below the current price, which supports the upward scenario.
• SMA #5 (blue) - long -term, is lower (approx. 18.85), so the main trend is not completely inverted yet, but the momentum is growing.
3. MacD
• The MacD line pierced the signal line from the bottom - buy signal.
• The histogram has gone down in positive values - the growing pressure of buyers.
4. RSI
• RSI around 55–60 - far from the purchase zone (70+), so theoretically there is still space for growth.
• RSI has pierced its average, which is confirmed by bull's sentiment.
5. Scenarios
• Bull: Maintenance of a price above 22.30 and a possible retest 24.50 with an attempt to break in the direction of 26.00. At 26.00 - road to 27.00–28.00.
• Bear: a decrease below 22.30 opens the road to 21.02, and a deeper descent - around 19.80 or 18.85.
6. Applications
• Short -term - advantage of buyers, but strong resistance at 24.50.
• A good moment for swing traders to watch the reaction at 24.50.
• For long -term positions - full confirmation of the trend reversal only after 26.00.
• The price is currently 23.71 USDT (+6.75% on the day).
• After an earlier inheritance trend (yellow dotted line - trend line), you can see an attempt to break up and maintain above SMA 1 (approx. 22.30 USDT).
• The next resistance is 24.50 and 26.00 USDT - you can see that the supply of supply was already 24.50.
• The next support is 22.30 and stronger at 21.02 USDT.
2. Medium walking (SMA)
• SMA #1 (red) - short -term, the price is above, which is a bull signal.
• SMA #2 (green) - medium -term, also below the current price, which supports the upward scenario.
• SMA #5 (blue) - long -term, is lower (approx. 18.85), so the main trend is not completely inverted yet, but the momentum is growing.
3. MacD
• The MacD line pierced the signal line from the bottom - buy signal.
• The histogram has gone down in positive values - the growing pressure of buyers.
4. RSI
• RSI around 55–60 - far from the purchase zone (70+), so theoretically there is still space for growth.
• RSI has pierced its average, which is confirmed by bull's sentiment.
5. Scenarios
• Bull: Maintenance of a price above 22.30 and a possible retest 24.50 with an attempt to break in the direction of 26.00. At 26.00 - road to 27.00–28.00.
• Bear: a decrease below 22.30 opens the road to 21.02, and a deeper descent - around 19.80 or 18.85.
6. Applications
• Short -term - advantage of buyers, but strong resistance at 24.50.
• A good moment for swing traders to watch the reaction at 24.50.
• For long -term positions - full confirmation of the trend reversal only after 26.00.

คำจำกัดสิทธิ์ความรับผิดชอบ
ข้อมูลและบทความไม่ได้มีวัตถุประสงค์เพื่อก่อให้เกิดกิจกรรมทางการเงิน, การลงทุน, การซื้อขาย, ข้อเสนอแนะ หรือคำแนะนำประเภทอื่น ๆ ที่ให้หรือรับรองโดย TradingView อ่านเพิ่มเติมใน ข้อกำหนดการใช้งาน
คำจำกัดสิทธิ์ความรับผิดชอบ
ข้อมูลและบทความไม่ได้มีวัตถุประสงค์เพื่อก่อให้เกิดกิจกรรมทางการเงิน, การลงทุน, การซื้อขาย, ข้อเสนอแนะ หรือคำแนะนำประเภทอื่น ๆ ที่ให้หรือรับรองโดย TradingView อ่านเพิ่มเติมใน ข้อกำหนดการใช้งาน