
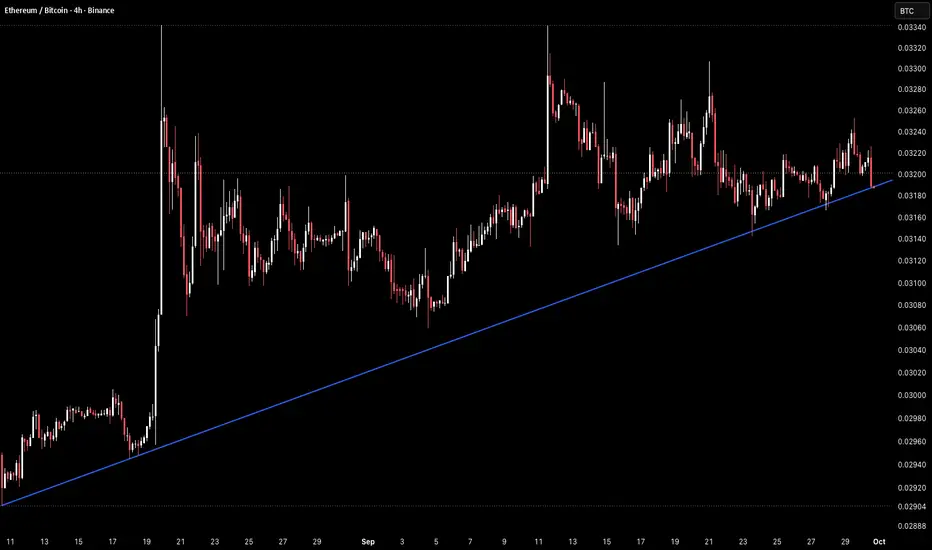
Ethereum against Bitcoin is trading around 0.03188 on the 4H timeframe, pressing right into the ascending trendline that has supported this ratio since the mid August low near 0.02904, with this level now aligning almost exactly with the horizontal support zone near 0.0318 to 0.0320.
The structure here shows a sharp initial spike off that trendline origin in mid August, followed by an extended choppy consolidation through most of September, with price oscillating between roughly 0.0308 and 0.0330 without a clear directional resolution. Within that range, two separate pushes toward 0.0330 were both sold into fairly quickly, while pullbacks have repeatedly found support in the 0.0310 to 0.0318 area. The trendline has now risen enough to intersect directly with this lower boundary, making the current test more significant than prior touches.
Price is currently sitting right at this confluence after rolling over from the recent high near 0.0324, putting real pressure on whether the trendline can continue holding.
Key Levels To Watch:
→ 0.0330 Range high, repeated rejection zone
→ 0.0324 Recent swing high, resistance on a bounce
→ 0.0320 Horizontal support, near term level
→ 0.0318 Current price, testing trendline and horizontal confluence
→ 0.0308 Range low, prior consolidation support
→ 0.0290 Trendline origin, mid August low
Holding this confluence keeps ETH's relative structure against BTC intact, and a reclaim of 0.0324 would set up another attempt at the 0.0330 range highs, with a clean break above finally resolving this range to the upside.
Losing this level would be the first real breakdown since mid August, opening the door to a deeper retracement back toward 0.0308 and putting the broader outperformance trend into question.
Hold the trendline and ETH continues consolidating for another leg higher against BTC. Lose it and this range breaks down.
Bias stays neutral to cautiously bullish given the trendline and horizontal support are aligning here, but this test is the level that determines whether the ratio breaks its range in either direction.

คำจำกัดสิทธิ์ความรับผิดชอบ
ข้อมูลและบทความไม่ได้มีวัตถุประสงค์เพื่อก่อให้เกิดกิจกรรมทางการเงิน, การลงทุน, การซื้อขาย, ข้อเสนอแนะ หรือคำแนะนำประเภทอื่น ๆ ที่ให้หรือรับรองโดย TradingView อ่านเพิ่มเติมใน ข้อกำหนดการใช้งาน
คำจำกัดสิทธิ์ความรับผิดชอบ
ข้อมูลและบทความไม่ได้มีวัตถุประสงค์เพื่อก่อให้เกิดกิจกรรมทางการเงิน, การลงทุน, การซื้อขาย, ข้อเสนอแนะ หรือคำแนะนำประเภทอื่น ๆ ที่ให้หรือรับรองโดย TradingView อ่านเพิ่มเติมใน ข้อกำหนดการใช้งาน