
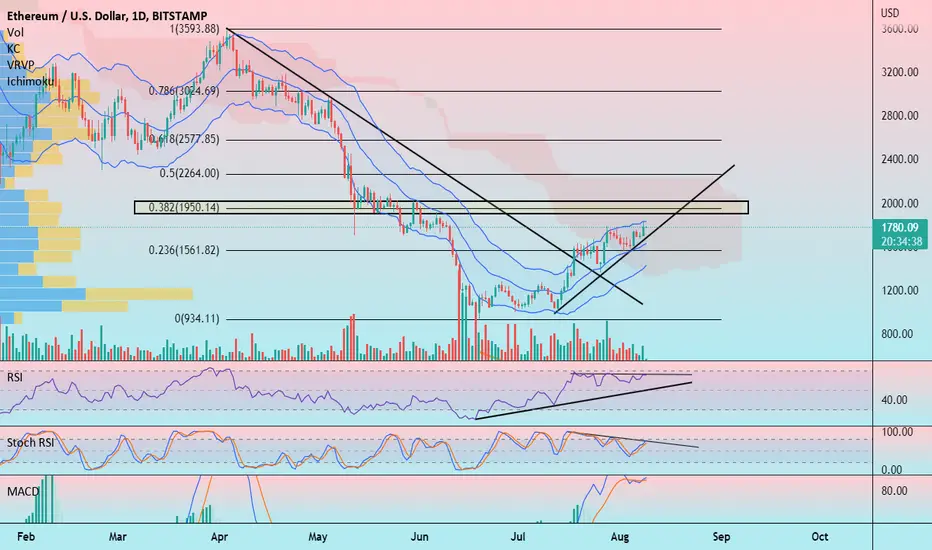
Hello friends, today you can review the technical analysis idea on a 1D linear scale chart for Ethereum (ETHUSD).
Ethereum price has been rising since the July lows. The chart shows a variety of signals with potential for upward movement around the resistance areas at the top of the Keltner Channel (KC) near the 0.382 Fibonacci level. A major concern is Volume dropping off.
Also Included: Fibonacci Retracement, RSI, MACD, Stochastic RSI, Ichimoku Cloud, and VPVR.
If you enjoy my ideas, feel free to like it and drop in a comment. I love reading your comments below.
Disclosure: This is just my opinion and not any type of financial advice. I enjoy charting and discussing technical analysis . Don't trade based on my advice. Do your own research! #cryptopickk
Ethereum price has been rising since the July lows. The chart shows a variety of signals with potential for upward movement around the resistance areas at the top of the Keltner Channel (KC) near the 0.382 Fibonacci level. A major concern is Volume dropping off.
Also Included: Fibonacci Retracement, RSI, MACD, Stochastic RSI, Ichimoku Cloud, and VPVR.
If you enjoy my ideas, feel free to like it and drop in a comment. I love reading your comments below.
Disclosure: This is just my opinion and not any type of financial advice. I enjoy charting and discussing technical analysis . Don't trade based on my advice. Do your own research! #cryptopickk

การนำเสนอที่เกี่ยวข้อง
คำจำกัดสิทธิ์ความรับผิดชอบ
ข้อมูลและบทความไม่ได้มีวัตถุประสงค์เพื่อก่อให้เกิดกิจกรรมทางการเงิน, การลงทุน, การซื้อขาย, ข้อเสนอแนะ หรือคำแนะนำประเภทอื่น ๆ ที่ให้หรือรับรองโดย TradingView อ่านเพิ่มเติมใน ข้อกำหนดการใช้งาน
การนำเสนอที่เกี่ยวข้อง
คำจำกัดสิทธิ์ความรับผิดชอบ
ข้อมูลและบทความไม่ได้มีวัตถุประสงค์เพื่อก่อให้เกิดกิจกรรมทางการเงิน, การลงทุน, การซื้อขาย, ข้อเสนอแนะ หรือคำแนะนำประเภทอื่น ๆ ที่ให้หรือรับรองโดย TradingView อ่านเพิ่มเติมใน ข้อกำหนดการใช้งาน