
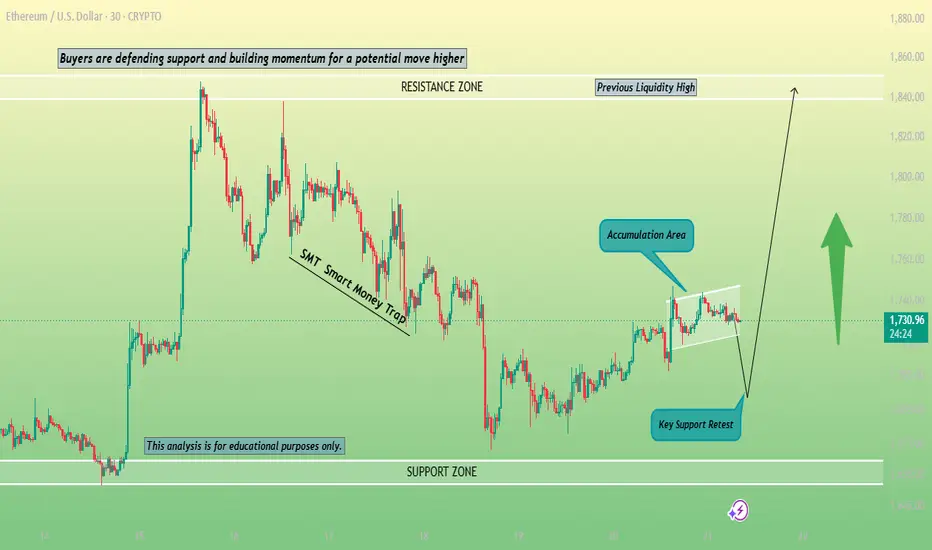
This chart showcases an educational analysis of ETHUSD using market structure, liquidity concepts, and price action principles. After forming an SMT Divergence, the market experienced a bearish move that led price into a strong Support Zone, where buying interest emerged and prevented further downside expansion.
Currently, Ethereum is holding above a key demand area and consolidating within a bullish recovery phase. A temporary pullback into support may provide a potential reaction zone before continuation toward the highlighted Resistance Zone. This setup demonstrates how traders can identify support and resistance levels, liquidity shifts, trend continuation opportunities, and potential target areas while maintaining disciplined risk management.
🎯 Key Learning Points:
Understanding SMT Divergence
Identifying Support & Resistance Zones
Reading Market Structure Shifts
Recognizing Buyer and Seller Activity
Planning Entries with Confirmation
Managing Risk Effectively
Following High-Probability Trading Setups
⚠️ Educational Disclaimer:
This chart is shared for educational purposes only and does not constitute financial advice. Always perform your own analysis and use proper risk management before making trading decisions.
Currently, Ethereum is holding above a key demand area and consolidating within a bullish recovery phase. A temporary pullback into support may provide a potential reaction zone before continuation toward the highlighted Resistance Zone. This setup demonstrates how traders can identify support and resistance levels, liquidity shifts, trend continuation opportunities, and potential target areas while maintaining disciplined risk management.
🎯 Key Learning Points:
Understanding SMT Divergence
Identifying Support & Resistance Zones
Reading Market Structure Shifts
Recognizing Buyer and Seller Activity
Planning Entries with Confirmation
Managing Risk Effectively
Following High-Probability Trading Setups
⚠️ Educational Disclaimer:
This chart is shared for educational purposes only and does not constitute financial advice. Always perform your own analysis and use proper risk management before making trading decisions.
การซื้อขายยังคงดำเนินอยู่
just first target reached 
คำจำกัดสิทธิ์ความรับผิดชอบ
ข้อมูลและบทความไม่ได้มีวัตถุประสงค์เพื่อก่อให้เกิดกิจกรรมทางการเงิน, การลงทุน, การซื้อขาย, ข้อเสนอแนะ หรือคำแนะนำประเภทอื่น ๆ ที่ให้หรือรับรองโดย TradingView อ่านเพิ่มเติมใน ข้อกำหนดการใช้งาน
คำจำกัดสิทธิ์ความรับผิดชอบ
ข้อมูลและบทความไม่ได้มีวัตถุประสงค์เพื่อก่อให้เกิดกิจกรรมทางการเงิน, การลงทุน, การซื้อขาย, ข้อเสนอแนะ หรือคำแนะนำประเภทอื่น ๆ ที่ให้หรือรับรองโดย TradingView อ่านเพิ่มเติมใน ข้อกำหนดการใช้งาน