
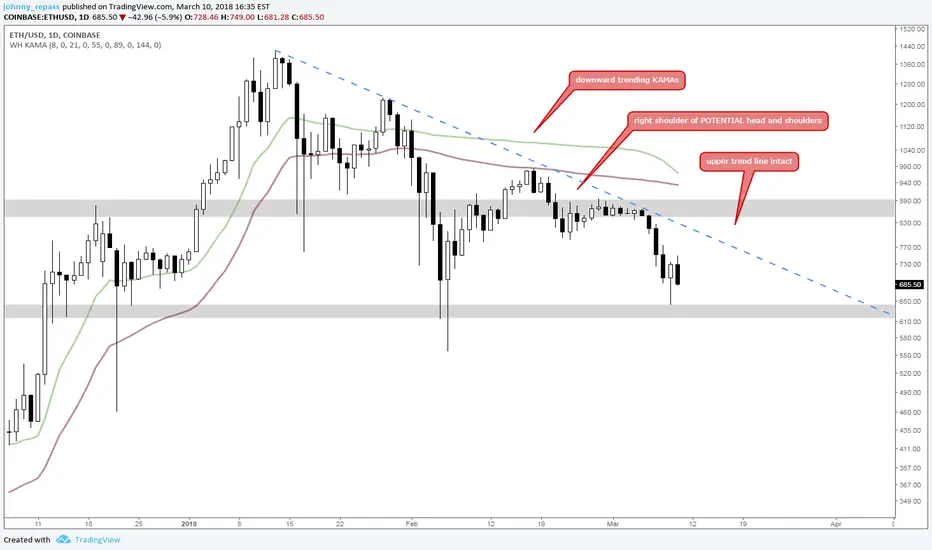
ETH-Live Trade Journal (daily chart)
3/10/2018
Etherium is still bearish on the daily chart--MAs are trending down, the upper trend line is intact, and we have formed a potential head and shoulders pattern over the last few months. The neckline is pretty unclear on the H&S but a break of support (gray band) is likely close enough. Until ETH breaks the upper trend line, I don't plan on trading the daily chart.
3/10/2018
Etherium is still bearish on the daily chart--MAs are trending down, the upper trend line is intact, and we have formed a potential head and shoulders pattern over the last few months. The neckline is pretty unclear on the H&S but a break of support (gray band) is likely close enough. Until ETH breaks the upper trend line, I don't plan on trading the daily chart.
บันทึก
ETH appears is the other side of a key support zone and is close to realizing the head and shoulders patterns.
คำจำกัดสิทธิ์ความรับผิดชอบ
ข้อมูลและบทความไม่ได้มีวัตถุประสงค์เพื่อก่อให้เกิดกิจกรรมทางการเงิน, การลงทุน, การซื้อขาย, ข้อเสนอแนะ หรือคำแนะนำประเภทอื่น ๆ ที่ให้หรือรับรองโดย TradingView อ่านเพิ่มเติมใน ข้อกำหนดการใช้งาน
คำจำกัดสิทธิ์ความรับผิดชอบ
ข้อมูลและบทความไม่ได้มีวัตถุประสงค์เพื่อก่อให้เกิดกิจกรรมทางการเงิน, การลงทุน, การซื้อขาย, ข้อเสนอแนะ หรือคำแนะนำประเภทอื่น ๆ ที่ให้หรือรับรองโดย TradingView อ่านเพิ่มเติมใน ข้อกำหนดการใช้งาน