
📊 ETH/USD Market Analysis – Bullish Pullback Toward Demand 🚀
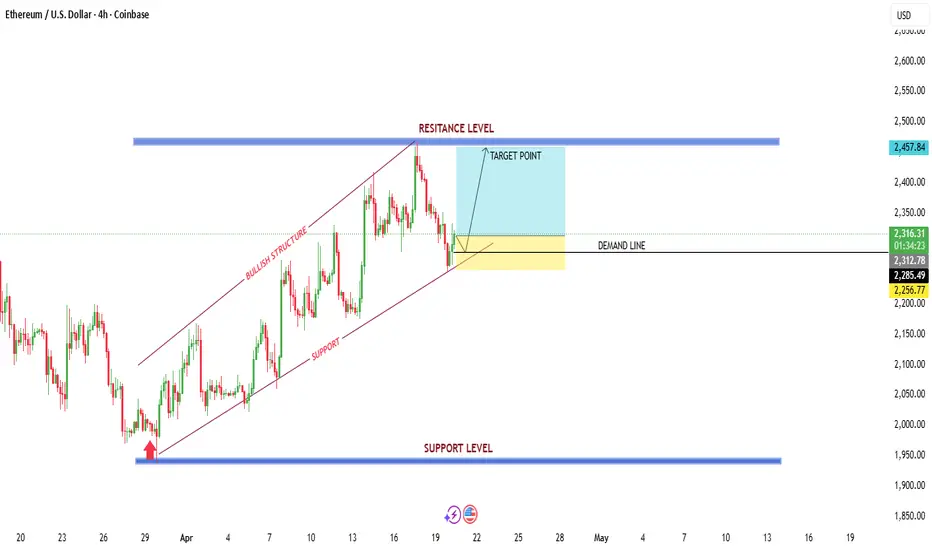
The chart shows a clear bullish structure on the 4H timeframe, with price respecting an ascending channel (higher highs & higher lows). However, recent price action suggests a healthy correction phase rather than a full trend reversal.
🔍 Key Observations
📈 Bullish Trend Intact
Price has been moving within a rising channel, confirming strong upward momentum.
🧱 Resistance Rejection
Price faced a sharp rejection from the marked resistance zone (~2450 area), indicating strong supply pressure at the top.
📉 Pullback to Demand Zone
Current retracement is approaching a demand zone (~2285–2255), which aligns with:
Previous structure support
Ascending trendline support
🔄 Potential Reversal Zone
The confluence of demand + trendline suggests a high-probability bounce area.
🎯 Trade Idea
🟢 Bullish Scenario (Preferred)
If price holds the demand zone:
Expect continuation toward target zone (~2450 resistance)
Confirmation needed via bullish candles / rejection wicks
🔴 Bearish Scenario (Invalidation)
If price breaks below demand + trendline:
Structure weakens
deeper correction toward lower support (~2000 zone)
🧠 Smart Insight
This looks like a classic “buy-the-dip” setup in an uptrend — but only if buyers defend the demand zone. Patience for confirmation is key.
⚡ Conclusion:
Market remains bullish overall, and this pullback could offer a strategic entry opportunity if support holds.
The chart shows a clear bullish structure on the 4H timeframe, with price respecting an ascending channel (higher highs & higher lows). However, recent price action suggests a healthy correction phase rather than a full trend reversal.
🔍 Key Observations
📈 Bullish Trend Intact
Price has been moving within a rising channel, confirming strong upward momentum.
🧱 Resistance Rejection
Price faced a sharp rejection from the marked resistance zone (~2450 area), indicating strong supply pressure at the top.
📉 Pullback to Demand Zone
Current retracement is approaching a demand zone (~2285–2255), which aligns with:
Previous structure support
Ascending trendline support
🔄 Potential Reversal Zone
The confluence of demand + trendline suggests a high-probability bounce area.
🎯 Trade Idea
🟢 Bullish Scenario (Preferred)
If price holds the demand zone:
Expect continuation toward target zone (~2450 resistance)
Confirmation needed via bullish candles / rejection wicks
🔴 Bearish Scenario (Invalidation)
If price breaks below demand + trendline:
Structure weakens
deeper correction toward lower support (~2000 zone)
🧠 Smart Insight
This looks like a classic “buy-the-dip” setup in an uptrend — but only if buyers defend the demand zone. Patience for confirmation is key.
⚡ Conclusion:
Market remains bullish overall, and this pullback could offer a strategic entry opportunity if support holds.
การซื้อขายยังคงดำเนินอยู่
Clean structure and strong respect of demand — momentum is building and price is steadily pushing toward the target zone. Bullish bias remains intact as long as support holds. 📈

✦ MARKET STRATEGY SIGNALS ✦ 📊
Smart Money • Price Action • Precision • good entries
📲 Join Telegram: t.me/marketstrategyentry
Smart Money • Price Action • Precision • good entries
📲 Join Telegram: t.me/marketstrategyentry
การนำเสนอที่เกี่ยวข้อง
คำจำกัดสิทธิ์ความรับผิดชอบ
ข้อมูลและบทความไม่ได้มีวัตถุประสงค์เพื่อก่อให้เกิดกิจกรรมทางการเงิน, การลงทุน, การซื้อขาย, ข้อเสนอแนะ หรือคำแนะนำประเภทอื่น ๆ ที่ให้หรือรับรองโดย TradingView อ่านเพิ่มเติมใน ข้อกำหนดการใช้งาน
✦ MARKET STRATEGY SIGNALS ✦ 📊
Smart Money • Price Action • Precision • good entries
📲 Join Telegram: t.me/marketstrategyentry
Smart Money • Price Action • Precision • good entries
📲 Join Telegram: t.me/marketstrategyentry
การนำเสนอที่เกี่ยวข้อง
คำจำกัดสิทธิ์ความรับผิดชอบ
ข้อมูลและบทความไม่ได้มีวัตถุประสงค์เพื่อก่อให้เกิดกิจกรรมทางการเงิน, การลงทุน, การซื้อขาย, ข้อเสนอแนะ หรือคำแนะนำประเภทอื่น ๆ ที่ให้หรือรับรองโดย TradingView อ่านเพิ่มเติมใน ข้อกำหนดการใช้งาน