
This analysis uses market structure logic based on **BOS (Break of Structure), CHOCH (Change of Character), MSB (Market Structure Break), FVG (Fair Value Gap), OB (Order Block), and liquidity behavior**.
The structure is interpreted using swing highs/lows and momentum shifts to determine directional bias.
Current Market Structure: BULLISH
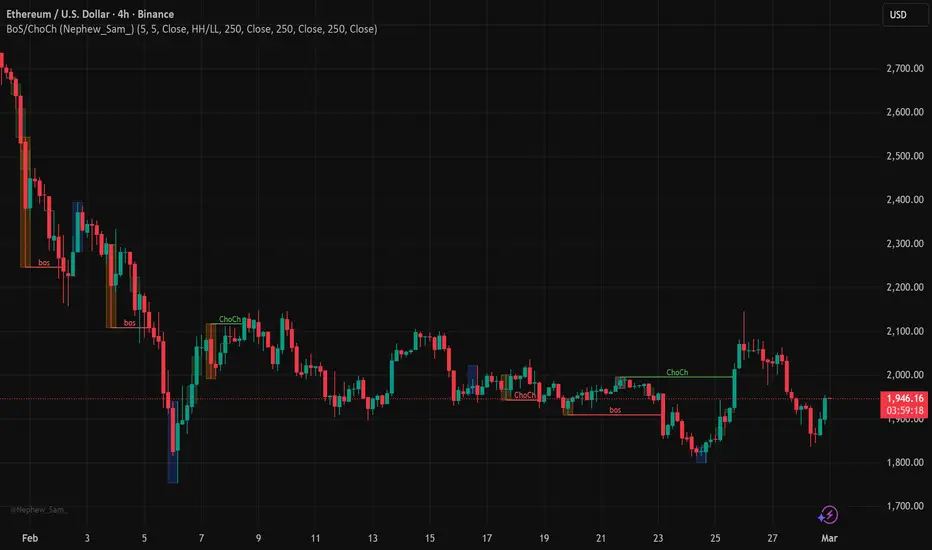
On the 4H timeframe, ETHUSD recently printed a CHOCH around $1980–$2000, breaking above the prior lower high. This signals a transition from bearish structure into bullish momentum.
There was also an earlier CHOCH around $1900–$1920, which initiated a short-term bullish expansion before the deeper retracement.
Following that:
This confirms a structural shift from bearish to bullish on the 4H timeframe.
Structural Components Observed
BOS / MSB
CHOCH
Higher High Formation
Expansion move above $2100 confirms bullish continuation structure.
Pullback Phase
Volatility
Multiple CHOCH and BOS formations indicate active structural shifts within broader bullish context.
What’s Likely Next
Bullish Scenario
If price sustains above the current recovery zone:
Bearish Scenario
If recovery fails:
Trading Approach
Moderate Strategy
Wait for confirmation of a higher low on 1H or 30M timeframe.
Look for:
Ideal area: Above $1900.
Stop loss: Below confirmed higher low.
Conservative Strategy
Bias Summary
4H Structure: Bullish
Momentum: Recovering
Invalidation Level: $1800–$1820
Continuation Target: $2100+
The market has transitioned structurally into bullish bias, but confirmation of a higher low is key before aggressive long positioning.
The structure is interpreted using swing highs/lows and momentum shifts to determine directional bias.
Current Market Structure: BULLISH
On the 4H timeframe, ETHUSD recently printed a CHOCH around $1980–$2000, breaking above the prior lower high. This signals a transition from bearish structure into bullish momentum.
There was also an earlier CHOCH around $1900–$1920, which initiated a short-term bullish expansion before the deeper retracement.
Following that:
- A strong bullish expansion pushed price above $2100, forming a new high.
- A significant pullback occurred, retracing into prior imbalance/structure.
- Current price (~$1954) shows recovery behavior after that retracement.
This confirms a structural shift from bearish to bullish on the 4H timeframe.
Structural Components Observed
BOS / MSB
- Break above prior lower high near $1980–$2000 = bullish MSB.
- Indicates momentum transition.
CHOCH
- Initial bullish CHOCH at $1900–$1920.
- Secondary confirmation CHOCH at $1980–$2000.
Higher High Formation
Expansion move above $2100 confirms bullish continuation structure.
Pullback Phase
- Retracement into prior demand / possible bullish OB zone.
- Current recovery suggests potential higher low formation.
Volatility
Multiple CHOCH and BOS formations indicate active structural shifts within broader bullish context.
What’s Likely Next
Bullish Scenario
If price sustains above the current recovery zone:
- Expect continuation toward 100 previous high.
- Possible breakout continuation if momentum strengthens.
- Formation of a 4H higher low would validate continuation bias.
Bearish Scenario
If recovery fails:
- * Price may retest $1800–$1820 demand zone.
- * A break below that level would invalidate short-term bullish bias.
- * That would convert structure back into bearish continuation.
Trading Approach
Moderate Strategy
Wait for confirmation of a higher low on 1H or 30M timeframe.
Look for:
- Bullish BOS on lower timeframe
- Strong displacement candle
- Bullish Order Block reaction
- FVG tap and rejection
Ideal area: Above $1900.
Stop loss: Below confirmed higher low.
Conservative Strategy
- Wait for break above minor high around $2000 (1H/30M).
- Confirm bullish continuation structure.
- Enter on retest of breakout level.
- Stop loss below consolidation base.
Bias Summary
4H Structure: Bullish
Momentum: Recovering
Invalidation Level: $1800–$1820
Continuation Target: $2100+
The market has transitioned structurally into bullish bias, but confirmation of a higher low is key before aggressive long positioning.

คำจำกัดสิทธิ์ความรับผิดชอบ
ข้อมูลและบทความไม่ได้มีวัตถุประสงค์เพื่อก่อให้เกิดกิจกรรมทางการเงิน, การลงทุน, การซื้อขาย, ข้อเสนอแนะ หรือคำแนะนำประเภทอื่น ๆ ที่ให้หรือรับรองโดย TradingView อ่านเพิ่มเติมใน ข้อกำหนดการใช้งาน
คำจำกัดสิทธิ์ความรับผิดชอบ
ข้อมูลและบทความไม่ได้มีวัตถุประสงค์เพื่อก่อให้เกิดกิจกรรมทางการเงิน, การลงทุน, การซื้อขาย, ข้อเสนอแนะ หรือคำแนะนำประเภทอื่น ๆ ที่ให้หรือรับรองโดย TradingView อ่านเพิ่มเติมใน ข้อกำหนดการใช้งาน