
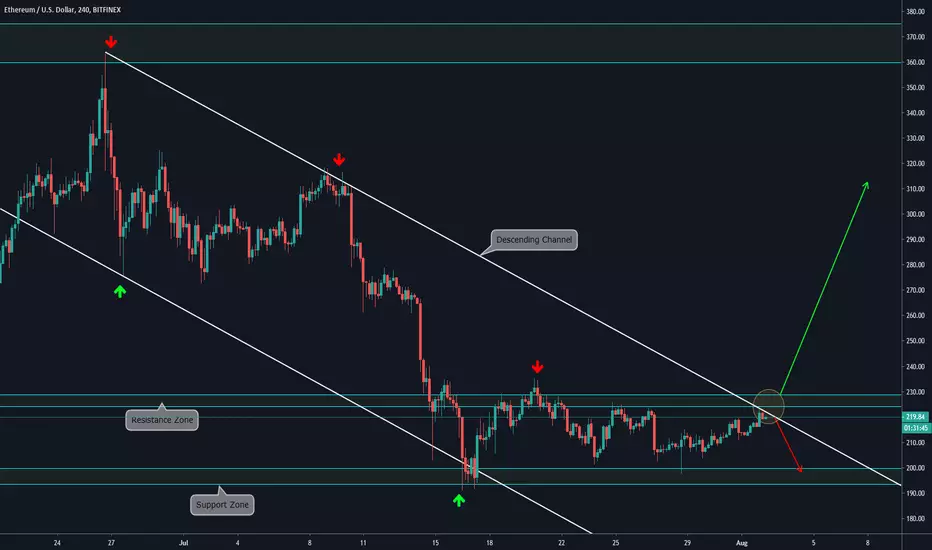
4H CHART EXPLANATION:
We observe that Ethereum has been moving sideways for a few days, and now it is facing the Descending Trendline and the Resistance Zone. If this zone is broke, we expect a bullish movement towards the next Resistance Zone. And, in case this zone can hold the price, it may bounce and retest the Support Zone again. Major movements are explained on the higher timeframes below.
MULTI TIMEFRAME ANALYSIS:
-Daily:

-Weekly:

We observe that Ethereum has been moving sideways for a few days, and now it is facing the Descending Trendline and the Resistance Zone. If this zone is broke, we expect a bullish movement towards the next Resistance Zone. And, in case this zone can hold the price, it may bounce and retest the Support Zone again. Major movements are explained on the higher timeframes below.
MULTI TIMEFRAME ANALYSIS:
-Daily:
-Weekly:

คำจำกัดสิทธิ์ความรับผิดชอบ
ข้อมูลและบทความไม่ได้มีวัตถุประสงค์เพื่อก่อให้เกิดกิจกรรมทางการเงิน, การลงทุน, การซื้อขาย, ข้อเสนอแนะ หรือคำแนะนำประเภทอื่น ๆ ที่ให้หรือรับรองโดย TradingView อ่านเพิ่มเติมใน ข้อกำหนดการใช้งาน
คำจำกัดสิทธิ์ความรับผิดชอบ
ข้อมูลและบทความไม่ได้มีวัตถุประสงค์เพื่อก่อให้เกิดกิจกรรมทางการเงิน, การลงทุน, การซื้อขาย, ข้อเสนอแนะ หรือคำแนะนำประเภทอื่น ๆ ที่ให้หรือรับรองโดย TradingView อ่านเพิ่มเติมใน ข้อกำหนดการใช้งาน