
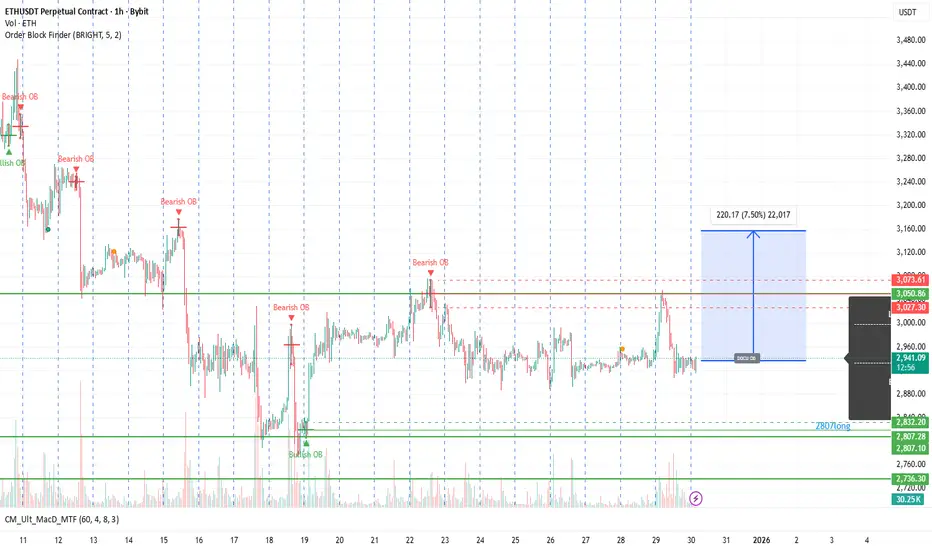
Why Ethereum Can Move Up to $3.2K From This Chart
1️⃣ Price Has Already Swept Sell-Side Liquidity
The sharp drop wiped out weak long positions
Large red candles with high volume indicate forced liquidations
After that, price stopped falling → meaning selling pressure is exhausted
👉 This is typically where smart money starts accumulating
2️⃣ Current Price Is Holding a Demand Zone (Bullish Order Block)
From the order-block data on the chart:
Bullish Order Block
Low: $3,100
Average: $3,113
High: $3,127
Price is consolidating inside / just below this zone
→ This signals successful defense by buyers
If price holds above this area, it confirms demand absorption
3️⃣ Bearish Order Block Is Losing Control
Bearish Order Block
Average: $3,005
Low: $2,982
Price failed to break down further after tapping this zone
→ Sellers already used most of their power
Sideways movement here is not weakness — it’s energy buildup
4️⃣ Why the Target Is Exactly $3.2K
$3.2K is a previous high-volume resistance zone
Large amount of short positions’ stop losses sit above
Once $3.1K breaks, short liquidation cascade is likely
👉 Price naturally moves toward maximum pain / maximum liquidity
5️⃣ Candlestick Structure Confirms Reversal Potential
Long lower wicks
Small candle bodies
Repeated failure to make new lows
This is classic selling exhaustion → rebound setup
6️⃣ High-Probability Scenario
Hold above $2.98K–$3.00K
Reclaim $3.05K
Break $3.10K
Accelerate toward $3.20K liquidity target
❗ Invalid Scenario
A strong close below $2.98K with volume
→ Bullish setup is delayed or invalidated
Final Summary
Ethereum is currently in a zone where downside is limited,
while upside is fueled by liquidity and short stops.
$3.2K is not a hope — it is a logical liquidity objective.
If you want, I can also explain:
Optimal long entry timing
Safe leverage zones
What happens after $3.2K is reached
1️⃣ Price Has Already Swept Sell-Side Liquidity
The sharp drop wiped out weak long positions
Large red candles with high volume indicate forced liquidations
After that, price stopped falling → meaning selling pressure is exhausted
👉 This is typically where smart money starts accumulating
2️⃣ Current Price Is Holding a Demand Zone (Bullish Order Block)
From the order-block data on the chart:
Bullish Order Block
Low: $3,100
Average: $3,113
High: $3,127
Price is consolidating inside / just below this zone
→ This signals successful defense by buyers
If price holds above this area, it confirms demand absorption
3️⃣ Bearish Order Block Is Losing Control
Bearish Order Block
Average: $3,005
Low: $2,982
Price failed to break down further after tapping this zone
→ Sellers already used most of their power
Sideways movement here is not weakness — it’s energy buildup
4️⃣ Why the Target Is Exactly $3.2K
$3.2K is a previous high-volume resistance zone
Large amount of short positions’ stop losses sit above
Once $3.1K breaks, short liquidation cascade is likely
👉 Price naturally moves toward maximum pain / maximum liquidity
5️⃣ Candlestick Structure Confirms Reversal Potential
Long lower wicks
Small candle bodies
Repeated failure to make new lows
This is classic selling exhaustion → rebound setup
6️⃣ High-Probability Scenario
Hold above $2.98K–$3.00K
Reclaim $3.05K
Break $3.10K
Accelerate toward $3.20K liquidity target
❗ Invalid Scenario
A strong close below $2.98K with volume
→ Bullish setup is delayed or invalidated
Final Summary
Ethereum is currently in a zone where downside is limited,
while upside is fueled by liquidity and short stops.
$3.2K is not a hope — it is a logical liquidity objective.
If you want, I can also explain:
Optimal long entry timing
Safe leverage zones
What happens after $3.2K is reached
ปิดการเทรด: ถึงเป้าหมายการทำกำไร
🔔 Update: $3.2K Target ReachedTarget Achieved ✅
Ethereum has successfully reached the $3.2K liquidity target, exactly as outlined in the previous analysis.
What Played Out As Expected
Sell-side liquidity sweep completed earlier
Price held and respected the $3.10K demand zone
Short positions were forced to cover once $3.10K broke
Price expanded into the $3.2K high-liquidity / resistance area
This move confirms that the rally was liquidity-driven, not emotional chasing.
📊 Current Situation
Price is now trading inside a prior resistance & high-volume zone
This is a logical area for profit-taking and reaction
Momentum is strong, but upside continuation requires consolidation or pullback
🔍 What I’m Watching Next
Reaction and acceptance above $3.18K–$3.20K
Volume behavior at resistance
Whether price consolidates (bullish) or rejects sharply (short-term correction)
⚠️ Important Note
This update is not a new long signal.
Chasing here carries higher risk.
Best opportunities usually come after reactions, not at targets.
Summary
✔ Liquidity target reached
✔ Analysis validated
✔ Next move depends on how price behaves at $3.2K resistance
Trade the reaction, not the excitement.
บันทึก
next havey dump coming every one runaway 
คำจำกัดสิทธิ์ความรับผิดชอบ
ข้อมูลและบทความไม่ได้มีวัตถุประสงค์เพื่อก่อให้เกิดกิจกรรมทางการเงิน, การลงทุน, การซื้อขาย, ข้อเสนอแนะ หรือคำแนะนำประเภทอื่น ๆ ที่ให้หรือรับรองโดย TradingView อ่านเพิ่มเติมใน ข้อกำหนดการใช้งาน
คำจำกัดสิทธิ์ความรับผิดชอบ
ข้อมูลและบทความไม่ได้มีวัตถุประสงค์เพื่อก่อให้เกิดกิจกรรมทางการเงิน, การลงทุน, การซื้อขาย, ข้อเสนอแนะ หรือคำแนะนำประเภทอื่น ๆ ที่ให้หรือรับรองโดย TradingView อ่านเพิ่มเติมใน ข้อกำหนดการใช้งาน