
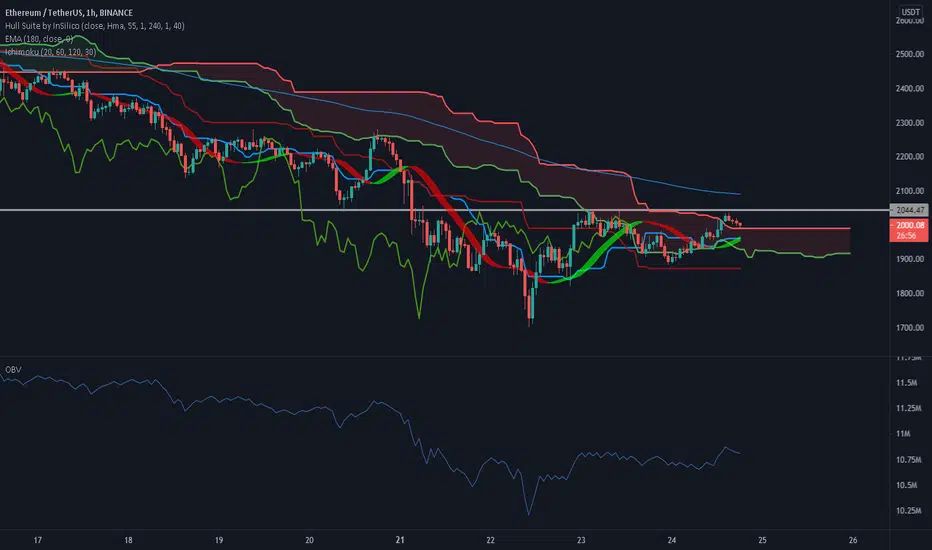
ETHUSDT is at resistance and the chances of a breakout look slim.
Based on my analysis, that:
I have looked at ETHUSDT in higher timeframes (Daily and 4HR) it really looks bearish based on what I have seen, (Links below).
I'm opening a short at 2013 with a STOP LOSS at 2070.
Based on my analysis, that:
- 2K is now resistance
- 180 EMA is acting as resistance above 2K
- We will reenter the Ichimoku cloud and move down
I have looked at ETHUSDT in higher timeframes (Daily and 4HR) it really looks bearish based on what I have seen, (Links below).
I'm opening a short at 2013 with a STOP LOSS at 2070.

การนำเสนอที่เกี่ยวข้อง
คำจำกัดสิทธิ์ความรับผิดชอบ
ข้อมูลและบทความไม่ได้มีวัตถุประสงค์เพื่อก่อให้เกิดกิจกรรมทางการเงิน, การลงทุน, การซื้อขาย, ข้อเสนอแนะ หรือคำแนะนำประเภทอื่น ๆ ที่ให้หรือรับรองโดย TradingView อ่านเพิ่มเติมใน ข้อกำหนดการใช้งาน
การนำเสนอที่เกี่ยวข้อง
คำจำกัดสิทธิ์ความรับผิดชอบ
ข้อมูลและบทความไม่ได้มีวัตถุประสงค์เพื่อก่อให้เกิดกิจกรรมทางการเงิน, การลงทุน, การซื้อขาย, ข้อเสนอแนะ หรือคำแนะนำประเภทอื่น ๆ ที่ให้หรือรับรองโดย TradingView อ่านเพิ่มเติมใน ข้อกำหนดการใช้งาน