
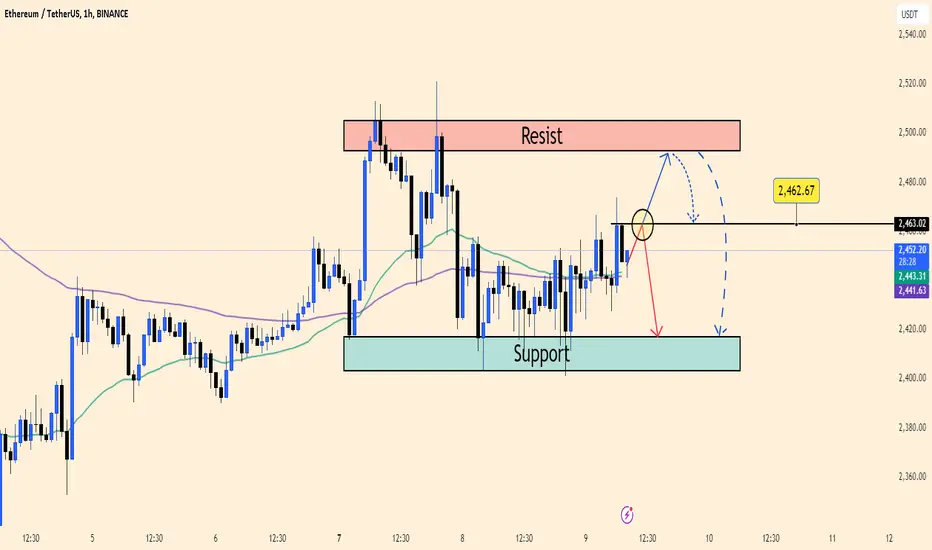
The ETH/USDT chart suggests a possible bearish move:
Resistance: Around $2,462, price may test this level but face rejection.
Support: The support zone is at $2,420, where the price could potentially fall.
Trading Plan: Short near $2,462 if rejection occurs, targeting the $2,420 support. Place a stop loss above $2,500 for safety.
This is a straightforward approach based on current chart patterns and key levels.
Resistance: Around $2,462, price may test this level but face rejection.
Support: The support zone is at $2,420, where the price could potentially fall.
Trading Plan: Short near $2,462 if rejection occurs, targeting the $2,420 support. Place a stop loss above $2,500 for safety.
This is a straightforward approach based on current chart patterns and key levels.
ปิดการเทรด: ถึงเป้าหมายการทำกำไร
nice 
การนำเสนอที่เกี่ยวข้อง
คำจำกัดสิทธิ์ความรับผิดชอบ
ข้อมูลและบทความไม่ได้มีวัตถุประสงค์เพื่อก่อให้เกิดกิจกรรมทางการเงิน, การลงทุน, การซื้อขาย, ข้อเสนอแนะ หรือคำแนะนำประเภทอื่น ๆ ที่ให้หรือรับรองโดย TradingView อ่านเพิ่มเติมใน ข้อกำหนดการใช้งาน
การนำเสนอที่เกี่ยวข้อง
คำจำกัดสิทธิ์ความรับผิดชอบ
ข้อมูลและบทความไม่ได้มีวัตถุประสงค์เพื่อก่อให้เกิดกิจกรรมทางการเงิน, การลงทุน, การซื้อขาย, ข้อเสนอแนะ หรือคำแนะนำประเภทอื่น ๆ ที่ให้หรือรับรองโดย TradingView อ่านเพิ่มเติมใน ข้อกำหนดการใช้งาน