
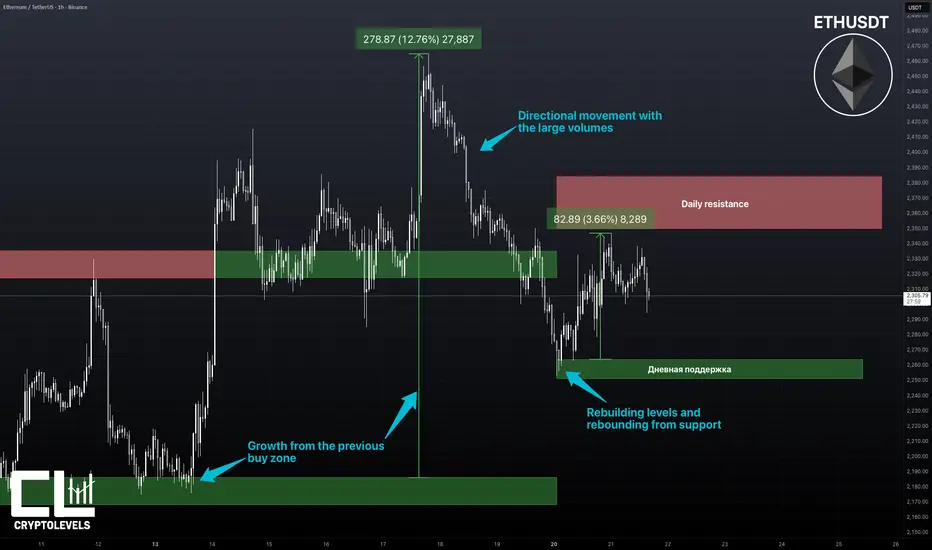
Ethereum's price returned to its current accumulation zone after a false downward breakout, which in itself is a significant signal of bears' weakness at the breakout. During the decline, the price clearly reached the daily level of 2251-2263, where it rebounded strongly. This zone acted as an area of interest for large bulls and confirmed the presence of demand. In fact, it was here that the market found support, preventing a downward movement from developing.
A return to the range after a false breakout creates a classic pattern of continued accumulation, but with the potential for an impulsive upward breakout. The price is now trading within the accumulation zone again, and further movement will directly depend on which side manages to establish control through volume. Bulls have already indicated their activity at the 2251-2263 level, and their key goal is to develop their initiative, drive the price to the daily resistance of 2350-2384, and break it, followed by consolidation. Only then can we expect a full-fledged upward breakout from accumulation and continued growth.
Despite the unsuccessful downward breakout, bears still have room to apply pressure. It's critical for them to increase volumes and retest the 2251-2263 support level, this time with an attempt to break through and consolidate below it. They can use the 2350-2384 resistance level as a working zone for position expansion, which remains their area of interest and a potential price reversal point. The market structure will largely depend on the reaction at this level.
Given Ethereum's historical behavior, such structures often play out through a series of false moves and range returns before the levels are rebuilt. This means that the current phase could be accompanied by increased volatility and both upward and downward swings before the market determines its direction. Key zones 2251-2263 and 2350-2384 remain the focus, and consolidation above one of them will signal the next significant move.
A return to the range after a false breakout creates a classic pattern of continued accumulation, but with the potential for an impulsive upward breakout. The price is now trading within the accumulation zone again, and further movement will directly depend on which side manages to establish control through volume. Bulls have already indicated their activity at the 2251-2263 level, and their key goal is to develop their initiative, drive the price to the daily resistance of 2350-2384, and break it, followed by consolidation. Only then can we expect a full-fledged upward breakout from accumulation and continued growth.
Despite the unsuccessful downward breakout, bears still have room to apply pressure. It's critical for them to increase volumes and retest the 2251-2263 support level, this time with an attempt to break through and consolidate below it. They can use the 2350-2384 resistance level as a working zone for position expansion, which remains their area of interest and a potential price reversal point. The market structure will largely depend on the reaction at this level.
Given Ethereum's historical behavior, such structures often play out through a series of false moves and range returns before the levels are rebuilt. This means that the current phase could be accompanied by increased volatility and both upward and downward swings before the market determines its direction. Key zones 2251-2263 and 2350-2384 remain the focus, and consolidation above one of them will signal the next significant move.

🔊 Ежедневный анализ: t.me/cryptolevels_ru
🔊 Everyday analysis: t.me/cryptolevels_en
🔊 Everyday analysis: t.me/cryptolevels_en
การนำเสนอที่เกี่ยวข้อง
คำจำกัดสิทธิ์ความรับผิดชอบ
ข้อมูลและบทความไม่ได้มีวัตถุประสงค์เพื่อก่อให้เกิดกิจกรรมทางการเงิน, การลงทุน, การซื้อขาย, ข้อเสนอแนะ หรือคำแนะนำประเภทอื่น ๆ ที่ให้หรือรับรองโดย TradingView อ่านเพิ่มเติมใน ข้อกำหนดการใช้งาน
🔊 Ежедневный анализ: t.me/cryptolevels_ru
🔊 Everyday analysis: t.me/cryptolevels_en
🔊 Everyday analysis: t.me/cryptolevels_en
การนำเสนอที่เกี่ยวข้อง
คำจำกัดสิทธิ์ความรับผิดชอบ
ข้อมูลและบทความไม่ได้มีวัตถุประสงค์เพื่อก่อให้เกิดกิจกรรมทางการเงิน, การลงทุน, การซื้อขาย, ข้อเสนอแนะ หรือคำแนะนำประเภทอื่น ๆ ที่ให้หรือรับรองโดย TradingView อ่านเพิ่มเติมใน ข้อกำหนดการใช้งาน