
🧭 Market Structure
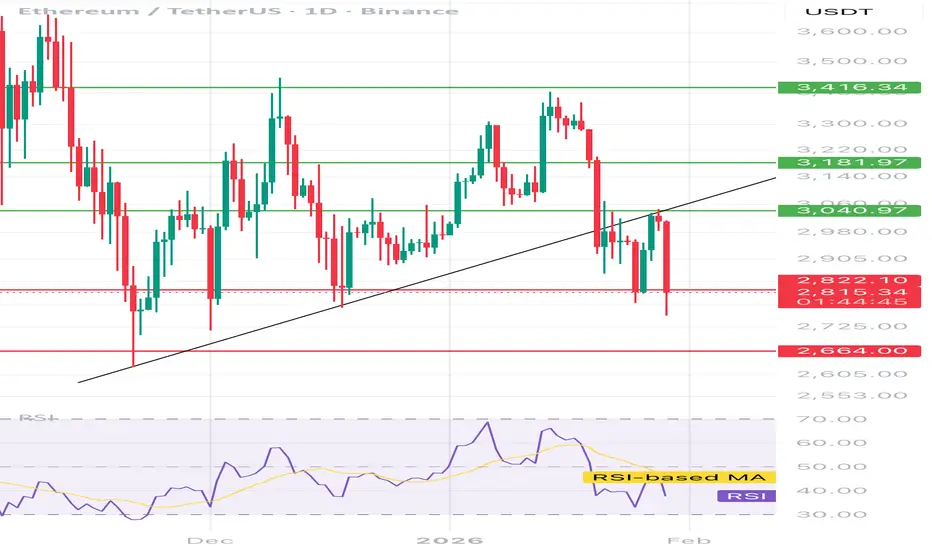
• Medium-term trend: was up, but was broken (uptrend line broken).
• Price: ~2820 – right at key support.
• The market entered a correction after the distribution (no new high-highs, heavy drops).
⸻
📉 Levels – this is the key
🔴 Supports
1. 2820–2800 – current lifeline
• Multiple tests
• Long wicks = demand is defensive, but getting weaker
2. 2664 – next strong support
• If 2800 breaks → a quick downward move is very likely
🟢 Resistances
1. 3040
• Now resistance after breaking support
• As long as below it → downward bias
2. 3180
• Strong S/R + previous price reaction
3. 3416
• Distribution/supply zone (biggers sold here)
⸻
📊 RSI (important)
• RSI below 50 → downward momentum
• RSI-based MA curves down → no confirmation of buyers' strength
• No There's still bullish divergence → watch out for false bounces.
⸻
🧠 Scenarios (specifics)
❌ Bearish scenario (more likely)
• Daily close < 2800
• Target:
• 2664
• then ~2500–2550 (if panic)
• This will be a classic breakout and continuation.
⚠️ Neutral scenario
• Consolidation 2800–3040
• Cutting SLs on both sides
• The market is "gathering fuel"
✅ Bullish scenario (conditional)
• Defense 2800 + daily close > 3040
• Then:
• 3180
• 3400+
• Without this → any bounce is a pullback to shorts
• Medium-term trend: was up, but was broken (uptrend line broken).
• Price: ~2820 – right at key support.
• The market entered a correction after the distribution (no new high-highs, heavy drops).
⸻
📉 Levels – this is the key
🔴 Supports
1. 2820–2800 – current lifeline
• Multiple tests
• Long wicks = demand is defensive, but getting weaker
2. 2664 – next strong support
• If 2800 breaks → a quick downward move is very likely
🟢 Resistances
1. 3040
• Now resistance after breaking support
• As long as below it → downward bias
2. 3180
• Strong S/R + previous price reaction
3. 3416
• Distribution/supply zone (biggers sold here)
⸻
📊 RSI (important)
• RSI below 50 → downward momentum
• RSI-based MA curves down → no confirmation of buyers' strength
• No There's still bullish divergence → watch out for false bounces.
⸻
🧠 Scenarios (specifics)
❌ Bearish scenario (more likely)
• Daily close < 2800
• Target:
• 2664
• then ~2500–2550 (if panic)
• This will be a classic breakout and continuation.
⚠️ Neutral scenario
• Consolidation 2800–3040
• Cutting SLs on both sides
• The market is "gathering fuel"
✅ Bullish scenario (conditional)
• Defense 2800 + daily close > 3040
• Then:
• 3180
• 3400+
• Without this → any bounce is a pullback to shorts

คำจำกัดสิทธิ์ความรับผิดชอบ
ข้อมูลและบทความไม่ได้มีวัตถุประสงค์เพื่อก่อให้เกิดกิจกรรมทางการเงิน, การลงทุน, การซื้อขาย, ข้อเสนอแนะ หรือคำแนะนำประเภทอื่น ๆ ที่ให้หรือรับรองโดย TradingView อ่านเพิ่มเติมใน ข้อกำหนดการใช้งาน
คำจำกัดสิทธิ์ความรับผิดชอบ
ข้อมูลและบทความไม่ได้มีวัตถุประสงค์เพื่อก่อให้เกิดกิจกรรมทางการเงิน, การลงทุน, การซื้อขาย, ข้อเสนอแนะ หรือคำแนะนำประเภทอื่น ๆ ที่ให้หรือรับรองโดย TradingView อ่านเพิ่มเติมใน ข้อกำหนดการใช้งาน