
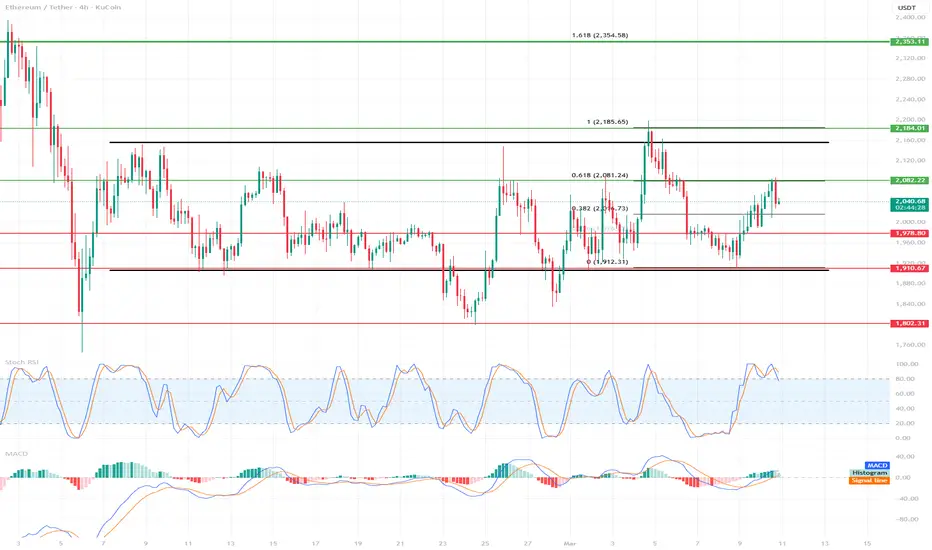
1️⃣ Market Structure
The market is moving in a range (consolidation) between:
1910–1920 – strong support
2180–2200 – strong resistance
The price is currently in the middle of the range around 2045.
This means:
➡️ no clear trend
➡️ trading mainly from level to level
📍 Key Levels
🟢 Resistance
2080 – local resistance (currently being tested)
2185 – main range resistance
2350 – next target after the breakout
🔴 Support
1978 – local support
1910 – very strong support
1800 – panic sell zone
📈 BULLISH Scenario
If ETH:
➡️ breaks 2080 and stays above the level
possible Targets:
2185
2350
Why:
MACD is starting to rise
Momentum is returning
Structure is making higher lows
📉 Bearish Scenario
If it rejects 2080:
Possible move to:
1️⃣ 1978
If it breaks:
2️⃣ 1910
📊 Indicators
Stoch RSI
In the overbought zone
Possible short pullback
MACD
Bullish momentum
Histogram is rising
➡️ A small correction is possible in the short term before further movement
📊 Most likely scenario
➡️ Consolidation from 1980 to 2080 for a while
Only then:
A breakout of 2180
or
A retest of 1920
🧠 Where smart money enters
Best Zones:
LONG
1975–1985
1910
SHORT
2170–2200
⚠️ One very important thing:
The chart shows multiple rejections of 2185.
If this level breaks:
➡️ There could be a very quick move to 2400+
The market is moving in a range (consolidation) between:
1910–1920 – strong support
2180–2200 – strong resistance
The price is currently in the middle of the range around 2045.
This means:
➡️ no clear trend
➡️ trading mainly from level to level
📍 Key Levels
🟢 Resistance
2080 – local resistance (currently being tested)
2185 – main range resistance
2350 – next target after the breakout
🔴 Support
1978 – local support
1910 – very strong support
1800 – panic sell zone
📈 BULLISH Scenario
If ETH:
➡️ breaks 2080 and stays above the level
possible Targets:
2185
2350
Why:
MACD is starting to rise
Momentum is returning
Structure is making higher lows
📉 Bearish Scenario
If it rejects 2080:
Possible move to:
1️⃣ 1978
If it breaks:
2️⃣ 1910
📊 Indicators
Stoch RSI
In the overbought zone
Possible short pullback
MACD
Bullish momentum
Histogram is rising
➡️ A small correction is possible in the short term before further movement
📊 Most likely scenario
➡️ Consolidation from 1980 to 2080 for a while
Only then:
A breakout of 2180
or
A retest of 1920
🧠 Where smart money enters
Best Zones:
LONG
1975–1985
1910
SHORT
2170–2200
⚠️ One very important thing:
The chart shows multiple rejections of 2185.
If this level breaks:
➡️ There could be a very quick move to 2400+

คำจำกัดสิทธิ์ความรับผิดชอบ
ข้อมูลและบทความไม่ได้มีวัตถุประสงค์เพื่อก่อให้เกิดกิจกรรมทางการเงิน, การลงทุน, การซื้อขาย, ข้อเสนอแนะ หรือคำแนะนำประเภทอื่น ๆ ที่ให้หรือรับรองโดย TradingView อ่านเพิ่มเติมใน ข้อกำหนดการใช้งาน
คำจำกัดสิทธิ์ความรับผิดชอบ
ข้อมูลและบทความไม่ได้มีวัตถุประสงค์เพื่อก่อให้เกิดกิจกรรมทางการเงิน, การลงทุน, การซื้อขาย, ข้อเสนอแนะ หรือคำแนะนำประเภทอื่น ๆ ที่ให้หรือรับรองโดย TradingView อ่านเพิ่มเติมใน ข้อกำหนดการใช้งาน