
Ethereum (ETH) technical analysis:
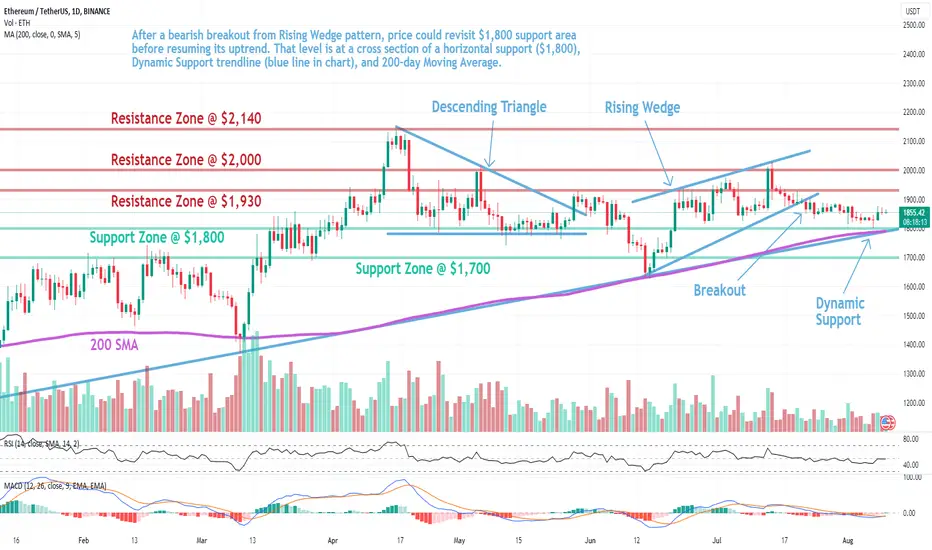
Trade setup: After a bearish breakout from Rising Wedge pattern, price could revisit $1,800 support area before resuming its uptrend. That level is at a cross section of a horizontal support ($1,800), Dynamic Support trendline (blue line in chart), and 200-day Moving Average.
Trend: Neutral on Short-Term basis, Uptrend on Medium-Term basis and Downtrend on Long-Term basis.
Momentum is Mixed as MACD Line is below MACD Signal Line (Bearish) but RSI ~ 50 (Neutral). MACD Histogram bars are rising, which suggests that momentum could be nearing another upswing.
Support and Resistance: Nearest Support Zone is $1,800 (previous resistance), then $1,700. The nearest Resistance Zone is $1,930, then $2,000 and $2,140.
Trade setup: After a bearish breakout from Rising Wedge pattern, price could revisit $1,800 support area before resuming its uptrend. That level is at a cross section of a horizontal support ($1,800), Dynamic Support trendline (blue line in chart), and 200-day Moving Average.
Trend: Neutral on Short-Term basis, Uptrend on Medium-Term basis and Downtrend on Long-Term basis.
Momentum is Mixed as MACD Line is below MACD Signal Line (Bearish) but RSI ~ 50 (Neutral). MACD Histogram bars are rising, which suggests that momentum could be nearing another upswing.
Support and Resistance: Nearest Support Zone is $1,800 (previous resistance), then $1,700. The nearest Resistance Zone is $1,930, then $2,000 and $2,140.

คำจำกัดสิทธิ์ความรับผิดชอบ
ข้อมูลและบทความไม่ได้มีวัตถุประสงค์เพื่อก่อให้เกิดกิจกรรมทางการเงิน, การลงทุน, การซื้อขาย, ข้อเสนอแนะ หรือคำแนะนำประเภทอื่น ๆ ที่ให้หรือรับรองโดย TradingView อ่านเพิ่มเติมใน ข้อกำหนดการใช้งาน
คำจำกัดสิทธิ์ความรับผิดชอบ
ข้อมูลและบทความไม่ได้มีวัตถุประสงค์เพื่อก่อให้เกิดกิจกรรมทางการเงิน, การลงทุน, การซื้อขาย, ข้อเสนอแนะ หรือคำแนะนำประเภทอื่น ๆ ที่ให้หรือรับรองโดย TradingView อ่านเพิ่มเติมใน ข้อกำหนดการใช้งาน