
Hey traders,
In this educational post, I want to discuss with you one of the most accurate REVERSAL candlestick patterns - the engulfing candle.
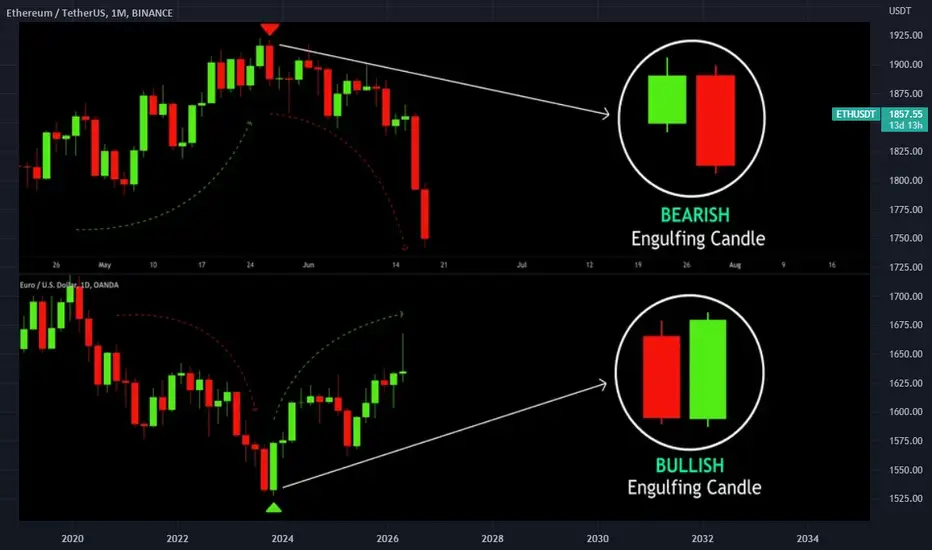
On ETHUSD chart, I spotted for you bullish & bearish examples of this pattern.
The logic behind this pattern is quite simple:
⭐️In a bullish trend, after a strong directional movement, the price reaches some important structure level. Growing steadily and forming a sequence of green bullish candles the price suddenly forms a strong bearish candle.
What is particular about that candle is the fact that its total range (distance from the wick high to wick low) & body range (distance from body open to body close) exceed the ranges of a previous bullish candle.
🔻Such a candle we will call a bearish engulfing candle.
Most of the time it signifies a strong spike in selling volumes and willingness of sellers to push.
With a high probability, such a formation leads to a pullback or even a trend reversal.

คำจำกัดสิทธิ์ความรับผิดชอบ
ข้อมูลและบทความไม่ได้มีวัตถุประสงค์เพื่อก่อให้เกิดกิจกรรมทางการเงิน, การลงทุน, การซื้อขาย, ข้อเสนอแนะ หรือคำแนะนำประเภทอื่น ๆ ที่ให้หรือรับรองโดย TradingView อ่านเพิ่มเติมใน ข้อกำหนดการใช้งาน
คำจำกัดสิทธิ์ความรับผิดชอบ
ข้อมูลและบทความไม่ได้มีวัตถุประสงค์เพื่อก่อให้เกิดกิจกรรมทางการเงิน, การลงทุน, การซื้อขาย, ข้อเสนอแนะ หรือคำแนะนำประเภทอื่น ๆ ที่ให้หรือรับรองโดย TradingView อ่านเพิ่มเติมใน ข้อกำหนดการใช้งาน