
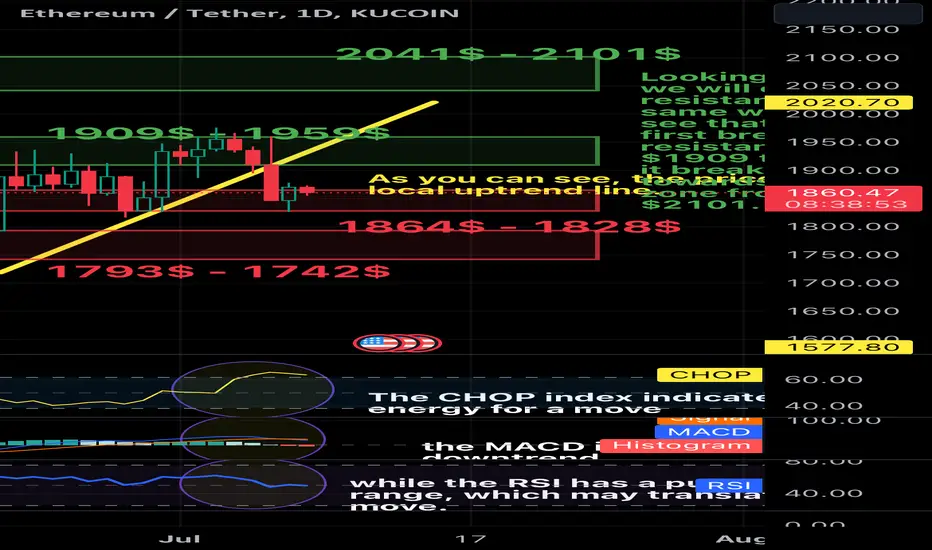
Hello everyone, let's look at the ETH to USDT chart on a single day time frame. As you can see, the price has fallen below the local uptrend line.
After unfolding the trend based fib extension grid, we see that the price stayed in the first support zone from $1864 to $1828, and then there is the second support zone from $1793 to $1742.
Looking the other way, we will check the resistances in the same way and here we see that the price must first break the resistance zone from $1909 to $1959, when it breaks it it will move towards the second zone from $2041 to $2101.
The CHOP index indicates that there is a lot of energy for a move, the MACD is on the verge of returning to a downtrend, while the RSI has a pullback to the middle of the range, which may translate into an upward price move.
After unfolding the trend based fib extension grid, we see that the price stayed in the first support zone from $1864 to $1828, and then there is the second support zone from $1793 to $1742.
Looking the other way, we will check the resistances in the same way and here we see that the price must first break the resistance zone from $1909 to $1959, when it breaks it it will move towards the second zone from $2041 to $2101.
The CHOP index indicates that there is a lot of energy for a move, the MACD is on the verge of returning to a downtrend, while the RSI has a pullback to the middle of the range, which may translate into an upward price move.

คำจำกัดสิทธิ์ความรับผิดชอบ
ข้อมูลและบทความไม่ได้มีวัตถุประสงค์เพื่อก่อให้เกิดกิจกรรมทางการเงิน, การลงทุน, การซื้อขาย, ข้อเสนอแนะ หรือคำแนะนำประเภทอื่น ๆ ที่ให้หรือรับรองโดย TradingView อ่านเพิ่มเติมใน ข้อกำหนดการใช้งาน
คำจำกัดสิทธิ์ความรับผิดชอบ
ข้อมูลและบทความไม่ได้มีวัตถุประสงค์เพื่อก่อให้เกิดกิจกรรมทางการเงิน, การลงทุน, การซื้อขาย, ข้อเสนอแนะ หรือคำแนะนำประเภทอื่น ๆ ที่ให้หรือรับรองโดย TradingView อ่านเพิ่มเติมใน ข้อกำหนดการใช้งาน