

Overview
⸻⸻⸻⸻⸻⸻⸻⸻⸻⸻⸻
📘 Concept
⸻⸻⸻⸻⸻⸻⸻⸻⸻⸻⸻
📊 Chart Highlights
⸻⸻⸻⸻⸻⸻⸻⸻⸻⸻⸻
📉 Key Price Action
⸻⸻⸻⸻⸻⸻⸻⸻⸻⸻⸻
📌 Summary
⸻⸻⸻⸻⸻⸻⸻⸻⸻⸻⸻
⚠️ Disclaimer
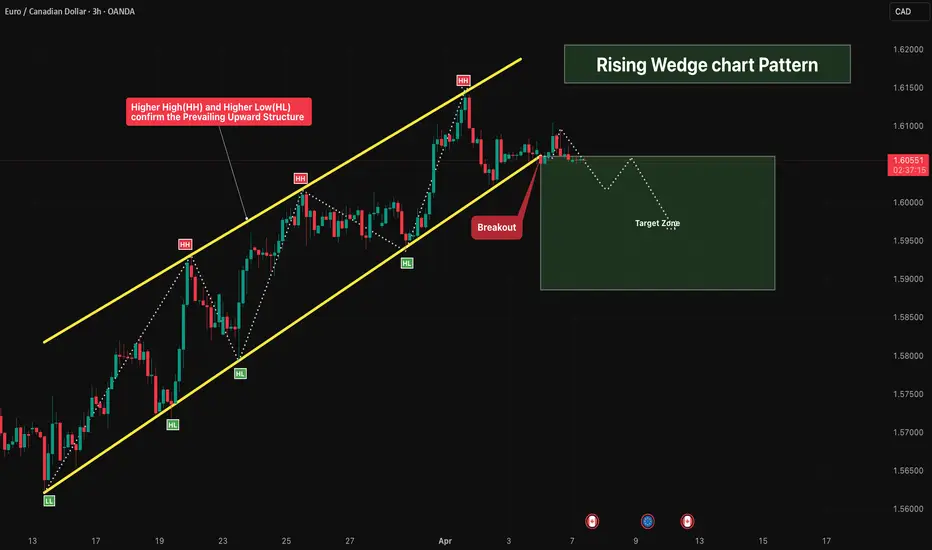
This chart illustrates a Rising Wedge pattern, where price is moving upward within two converging trendlines, indicating weakening bullish momentum.
⸻⸻⸻⸻⸻⸻⸻⸻⸻⸻⸻
📘 Concept
• Price forms Higher Highs (HH) and Higher Lows (HL), but the range starts to contract.
• The narrowing structure shows that buyers are losing strength.
• Momentum slows down even though price is still rising.
⸻⸻⸻⸻⸻⸻⸻⸻⸻⸻⸻
📊 Chart Highlights
• Clear rising wedge formation with converging trendlines.
• Higher highs and higher lows within a tightening range.
• Price approaching the upper boundary with reduced momentum.
• Breakdown zone marked below the lower trendline.
• Target zone projected after breakdown.
⸻⸻⸻⸻⸻⸻⸻⸻⸻⸻⸻
📉 Key Price Action
• Uptrend structure (HH & HL) is present but weakening.
• Price compression signals potential breakout/breakdown.
• Breakdown below the wedge confirms bearish intent.
• Retest of broken trendline can act as resistance.
• Sellers gain control after structure breakdown.
⸻⸻⸻⸻⸻⸻⸻⸻⸻⸻⸻
📌 Summary
The Rising Wedge is typically a bearish pattern, suggesting a possible reversal or continuation to the downside after breakdown. A confirmed break below the lower trendline increases the probability of further downside movement.
⸻⸻⸻⸻⸻⸻⸻⸻⸻⸻⸻
⚠️ Disclaimer
📘 For educational purposes only.
🙅 Not SEBI registered.
❌ Not a buy/sell recommendation.
🧠 Purely a learning resource.
📊 Not Financial Advice.

Pine Script Developer • Market Analysis
คำจำกัดสิทธิ์ความรับผิดชอบ
ข้อมูลและบทความไม่ได้มีวัตถุประสงค์เพื่อก่อให้เกิดกิจกรรมทางการเงิน, การลงทุน, การซื้อขาย, ข้อเสนอแนะ หรือคำแนะนำประเภทอื่น ๆ ที่ให้หรือรับรองโดย TradingView อ่านเพิ่มเติมใน ข้อกำหนดการใช้งาน
Pine Script Developer • Market Analysis
คำจำกัดสิทธิ์ความรับผิดชอบ
ข้อมูลและบทความไม่ได้มีวัตถุประสงค์เพื่อก่อให้เกิดกิจกรรมทางการเงิน, การลงทุน, การซื้อขาย, ข้อเสนอแนะ หรือคำแนะนำประเภทอื่น ๆ ที่ให้หรือรับรองโดย TradingView อ่านเพิ่มเติมใน ข้อกำหนดการใช้งาน