

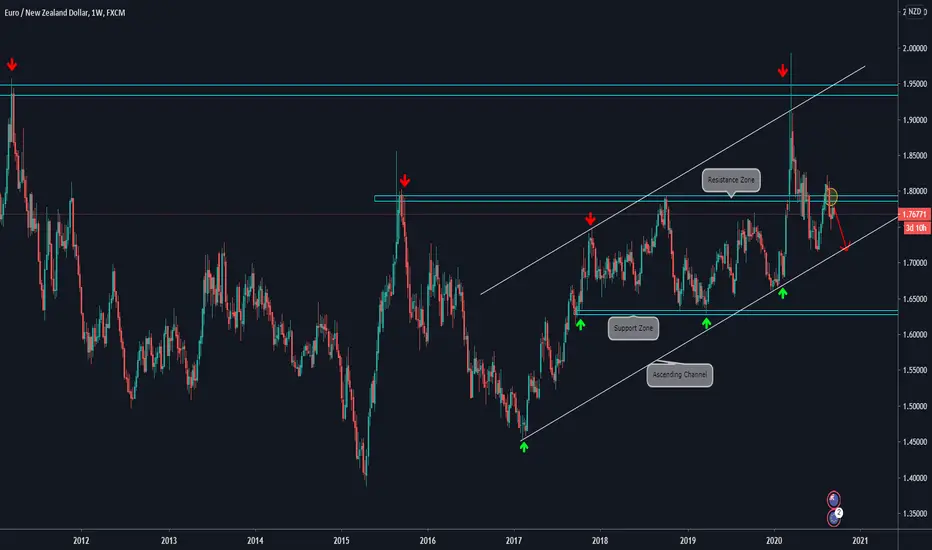
🔸WEEKLY CHART EXPLANATION:
.
.
🔸Price bounced at the Confluence Zone between the Ascending Channel and the Resistance Zone.
.
🔸It did a strong downside move breaking the Support Zone (now Resistance Zone).
.
🔸It has retested the zone again and we observe that was a strong rejection there. We consider that it has potential to reach the Ascending Trendline
.
🔸 Will look for a lower timeframe bearish setup.
🔸 DAILY CHART ANALYSIS:

.
.
🔸Price bounced at the Confluence Zone between the Ascending Channel and the Resistance Zone.
.
🔸It did a strong downside move breaking the Support Zone (now Resistance Zone).
.
🔸It has retested the zone again and we observe that was a strong rejection there. We consider that it has potential to reach the Ascending Trendline
.
🔸 Will look for a lower timeframe bearish setup.
🔸 DAILY CHART ANALYSIS:

คำจำกัดสิทธิ์ความรับผิดชอบ
ข้อมูลและบทความไม่ได้มีวัตถุประสงค์เพื่อก่อให้เกิดกิจกรรมทางการเงิน, การลงทุน, การซื้อขาย, ข้อเสนอแนะ หรือคำแนะนำประเภทอื่น ๆ ที่ให้หรือรับรองโดย TradingView อ่านเพิ่มเติมใน ข้อกำหนดการใช้งาน
คำจำกัดสิทธิ์ความรับผิดชอบ
ข้อมูลและบทความไม่ได้มีวัตถุประสงค์เพื่อก่อให้เกิดกิจกรรมทางการเงิน, การลงทุน, การซื้อขาย, ข้อเสนอแนะ หรือคำแนะนำประเภทอื่น ๆ ที่ให้หรือรับรองโดย TradingView อ่านเพิ่มเติมใน ข้อกำหนดการใช้งาน