

Overview
⸻⸻⸻⸻⸻⸻⸻⸻⸻⸻⸻
📘 Key Price Action
⸻⸻⸻⸻⸻⸻⸻⸻⸻⸻⸻
📊 Chart Explanation
⸻⸻⸻⸻⸻⸻⸻⸻⸻⸻⸻
Observation
⸻⸻⸻⸻⸻⸻⸻⸻⸻⸻⸻
## Future Outlook
⸻⸻⸻⸻⸻⸻⸻⸻⸻⸻⸻
📌 Summary
⸻⸻⸻⸻⸻⸻⸻⸻⸻⸻⸻
⚠️ Disclaimer
⸻⸻⸻⸻⸻⸻⸻⸻⸻⸻⸻
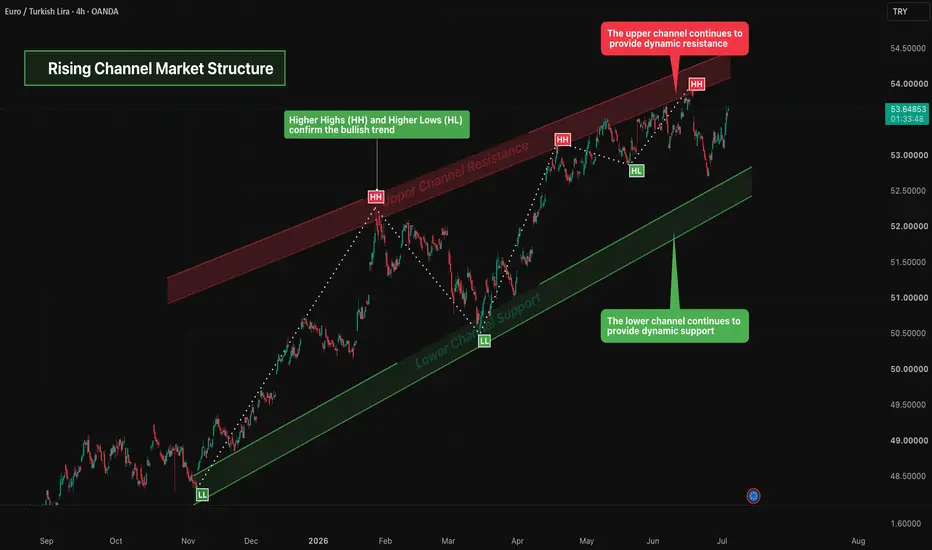
This chart highlights a Rising Channel Market Structure, where price continues to trade within two upward-sloping parallel trendlines. The formation reflects a sustained bullish trend, with higher highs and higher lows indicating continued buying interest.
⸻⸻⸻⸻⸻⸻⸻⸻⸻⸻⸻
📘 Key Price Action
- Price continues to respect the lower channel support.
- Higher Highs (HH) and Higher Lows (HL) confirm the bullish trend.
- The upper channel continues to provide dynamic resistance.
- The lower channel continues to provide dynamic support.
- Price remains confined within the ascending channel structure.
⸻⸻⸻⸻⸻⸻⸻⸻⸻⸻⸻
📊 Chart Explanation
- The lower boundary of the channel acts as dynamic support.
- The upper boundary of the channel acts as dynamic resistance.
- Buyers continue to defend higher price levels.
- Sellers remain active near the upper channel.
- Higher highs and higher lows reinforce the prevailing bullish market structure.
- The ascending channel continues to guide price movement.
⸻⸻⸻⸻⸻⸻⸻⸻⸻⸻⸻
Observation
- The market continues to maintain a healthy bullish trend.
- Price remains well supported within the channel.
- Both channel boundaries continue to influence market direction.
- No confirmed breakdown of the channel structure has occurred.
⸻⸻⸻⸻⸻⸻⸻⸻⸻⸻⸻
## Future Outlook
- The bullish trend remains intact while channel support holds.
- Continued respect of channel support may favor further upside movement.
- A breakout above the upper channel could strengthen bullish momentum.
- A close below the lower channel may indicate weakening momentum and a potential trend reversal.
⸻⸻⸻⸻⸻⸻⸻⸻⸻⸻⸻
📌 Summary
Price continues to trade within a well-defined Rising Channel Market Structure. As long as the lower channel support remains intact, the broader bullish trend continues to favor buyers. The channel boundaries remain the key areas to monitor for future market direction.
⸻⸻⸻⸻⸻⸻⸻⸻⸻⸻⸻
⚠️ Disclaimer
📘 For educational purposes only.
🙅 Not SEBI registered.
❌ Not a buy/sell recommendation.
🧠 Purely a learning resource.
📊 Not Financial Advice.
⸻⸻⸻⸻⸻⸻⸻⸻⸻⸻⸻

Pine Script Developer • Market Analysis
คำจำกัดสิทธิ์ความรับผิดชอบ
ข้อมูลและบทความไม่ได้มีวัตถุประสงค์เพื่อก่อให้เกิดกิจกรรมทางการเงิน, การลงทุน, การซื้อขาย, ข้อเสนอแนะ หรือคำแนะนำประเภทอื่น ๆ ที่ให้หรือรับรองโดย TradingView อ่านเพิ่มเติมใน ข้อกำหนดการใช้งาน
Pine Script Developer • Market Analysis
คำจำกัดสิทธิ์ความรับผิดชอบ
ข้อมูลและบทความไม่ได้มีวัตถุประสงค์เพื่อก่อให้เกิดกิจกรรมทางการเงิน, การลงทุน, การซื้อขาย, ข้อเสนอแนะ หรือคำแนะนำประเภทอื่น ๆ ที่ให้หรือรับรองโดย TradingView อ่านเพิ่มเติมใน ข้อกำหนดการใช้งาน