

Most traders stare at price.
We measure the behavior driving it.
What happens when you data-mine market structure itself?
You stop guessing — and start seeing probabilities behind every move.
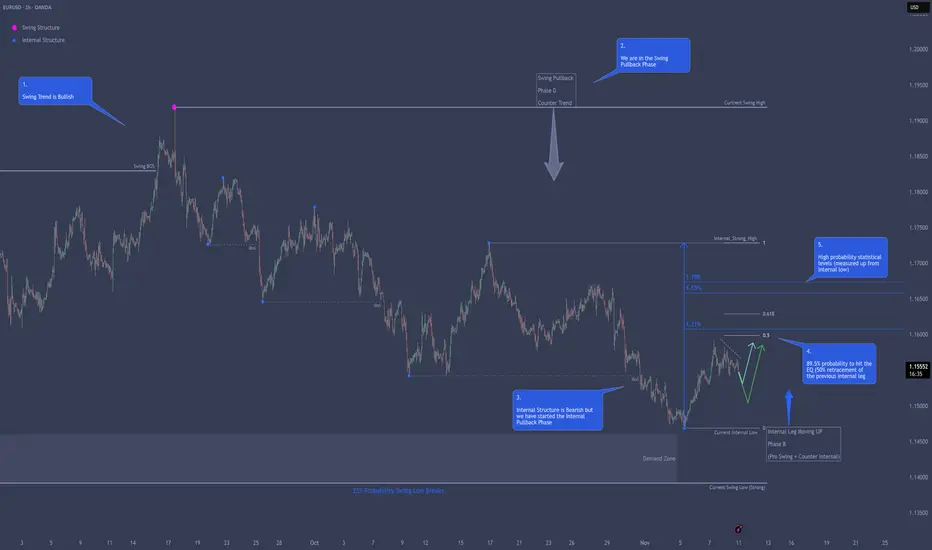
Structure Lab’s data shows an 89.5% probability that EUR/USD reaches the 50% retracement (EQ) of the prior internal leg — sitting above current price.
Here’s what the data says:
– Swing structure remains bullish (last BOS to the upside)
– Internal structure turned bearish to form the pullback, bottoming Nov 5 in a Phase C configuration (Counter Swing + Pro Internal)
– Now in Phase B (Pro Swing + Counter Internal), pushing higher
Monday printed an inside day — full range inside Friday’s high-low.
Price is drifting lower, stacking buy-side liquidity with descending highs — the kind of structure that often fuels the next impulse.
Three high-probability statistical levels rest above:
1.21%
1.65%
1.78%
(measured from the recent internal low)
Here’s the kicker — 80% of Phase B legs take 5–9 days to complete.
We’re only 2 days in.
The math leans higher.
📊 1-hour timeframe — price as behavior, not noise.
More high-probability setups dropping every week—follow for statistical edges you won't find anywhere else.
Want the full breakdown? Entry trigger, invalidation, and scaling strategy? Drop a "📊" in the comments and I'll share the complete game plan.
Let me know what you want to see more of. 👇
We measure the behavior driving it.
What happens when you data-mine market structure itself?
You stop guessing — and start seeing probabilities behind every move.
Structure Lab’s data shows an 89.5% probability that EUR/USD reaches the 50% retracement (EQ) of the prior internal leg — sitting above current price.
Here’s what the data says:
– Swing structure remains bullish (last BOS to the upside)
– Internal structure turned bearish to form the pullback, bottoming Nov 5 in a Phase C configuration (Counter Swing + Pro Internal)
– Now in Phase B (Pro Swing + Counter Internal), pushing higher
Monday printed an inside day — full range inside Friday’s high-low.
Price is drifting lower, stacking buy-side liquidity with descending highs — the kind of structure that often fuels the next impulse.
Three high-probability statistical levels rest above:
1.21%
1.65%
1.78%
(measured from the recent internal low)
Here’s the kicker — 80% of Phase B legs take 5–9 days to complete.
We’re only 2 days in.
The math leans higher.
📊 1-hour timeframe — price as behavior, not noise.
More high-probability setups dropping every week—follow for statistical edges you won't find anywhere else.
Want the full breakdown? Entry trigger, invalidation, and scaling strategy? Drop a "📊" in the comments and I'll share the complete game plan.
Let me know what you want to see more of. 👇

คำจำกัดสิทธิ์ความรับผิดชอบ
ข้อมูลและบทความไม่ได้มีวัตถุประสงค์เพื่อก่อให้เกิดกิจกรรมทางการเงิน, การลงทุน, การซื้อขาย, ข้อเสนอแนะ หรือคำแนะนำประเภทอื่น ๆ ที่ให้หรือรับรองโดย TradingView อ่านเพิ่มเติมใน ข้อกำหนดการใช้งาน
คำจำกัดสิทธิ์ความรับผิดชอบ
ข้อมูลและบทความไม่ได้มีวัตถุประสงค์เพื่อก่อให้เกิดกิจกรรมทางการเงิน, การลงทุน, การซื้อขาย, ข้อเสนอแนะ หรือคำแนะนำประเภทอื่น ๆ ที่ให้หรือรับรองโดย TradingView อ่านเพิ่มเติมใน ข้อกำหนดการใช้งาน