

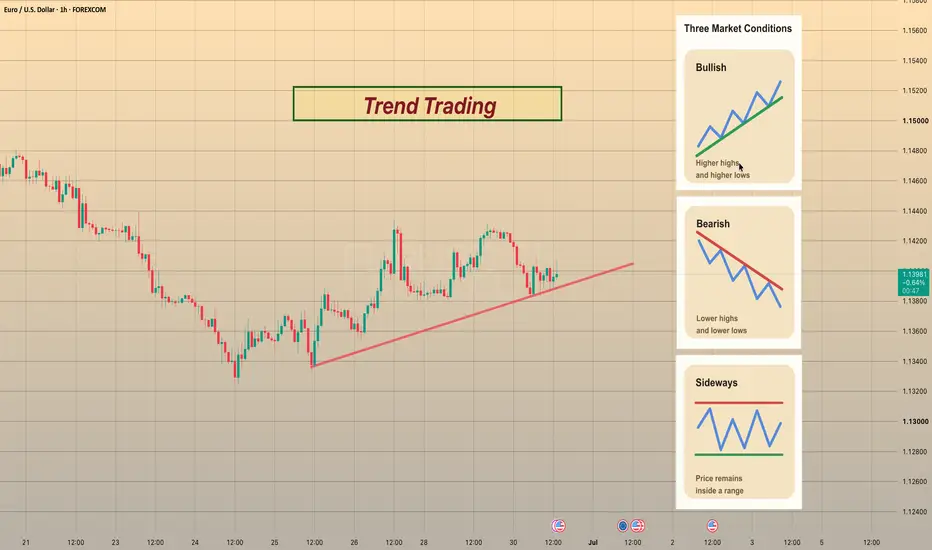
📈 A trend is the general direction of price movement.
• If the price goes up → it’s a bullish trend 📊
• If the price goes down → it’s a bearish trend 📉
When price moves sideways within a range, it’s called a sideways trend (or flat market). This means there is no clear direction.
Understanding trends helps you enter trades at better moments and reduce risk while the trend continues.
⚙️ How It Works
The easiest way to spot a trend is by drawing a trend line.
• Connect several highs or lows with a straight line
• If the line goes up → trend is bullish
• If it goes down → trend is bearish
You can also use a Moving Average indicator to see the trend direction.
In a sideways market, price often moves between horizontal levels or without a clear structure.
💡Trading Tips
A common strategy is to open trades when a candlestick pattern appears near a trend line.
Basic rules:
• In a downtrend → draw the line across the highs
• In an uptrend → draw it across the lows
• First two points show the trend
• From the third touch → you can look for trade entries
Even if one trade loses, earlier trades in the trend often cover that loss.
⚠️ Important Notes
• Candle shadows can slightly cross the trend line — that’s normal
• Combining trend lines + candlestick patterns improves accuracy
• Don’t assume the trend will reverse soon
Remember: “The trend is your friend” 🤝
It’s usually better to follow the trend than try to predict when it will end.
• If the price goes up → it’s a bullish trend 📊
• If the price goes down → it’s a bearish trend 📉
When price moves sideways within a range, it’s called a sideways trend (or flat market). This means there is no clear direction.
Understanding trends helps you enter trades at better moments and reduce risk while the trend continues.
⚙️ How It Works
The easiest way to spot a trend is by drawing a trend line.
• Connect several highs or lows with a straight line
• If the line goes up → trend is bullish
• If it goes down → trend is bearish
You can also use a Moving Average indicator to see the trend direction.
In a sideways market, price often moves between horizontal levels or without a clear structure.
💡Trading Tips
A common strategy is to open trades when a candlestick pattern appears near a trend line.
Basic rules:
• In a downtrend → draw the line across the highs
• In an uptrend → draw it across the lows
• First two points show the trend
• From the third touch → you can look for trade entries
Even if one trade loses, earlier trades in the trend often cover that loss.
⚠️ Important Notes
• Candle shadows can slightly cross the trend line — that’s normal
• Combining trend lines + candlestick patterns improves accuracy
• Don’t assume the trend will reverse soon
Remember: “The trend is your friend” 🤝
It’s usually better to follow the trend than try to predict when it will end.

Join me, I'll guide you to PROFITABLE TRADING💵!
Telegram Channel:
t.me/elibrianalytics
Telegram Channel:
t.me/elibrianalytics
คำจำกัดสิทธิ์ความรับผิดชอบ
ข้อมูลและบทความไม่ได้มีวัตถุประสงค์เพื่อก่อให้เกิดกิจกรรมทางการเงิน, การลงทุน, การซื้อขาย, ข้อเสนอแนะ หรือคำแนะนำประเภทอื่น ๆ ที่ให้หรือรับรองโดย TradingView อ่านเพิ่มเติมใน ข้อกำหนดการใช้งาน
Join me, I'll guide you to PROFITABLE TRADING💵!
Telegram Channel:
t.me/elibrianalytics
Telegram Channel:
t.me/elibrianalytics
คำจำกัดสิทธิ์ความรับผิดชอบ
ข้อมูลและบทความไม่ได้มีวัตถุประสงค์เพื่อก่อให้เกิดกิจกรรมทางการเงิน, การลงทุน, การซื้อขาย, ข้อเสนอแนะ หรือคำแนะนำประเภทอื่น ๆ ที่ให้หรือรับรองโดย TradingView อ่านเพิ่มเติมใน ข้อกำหนดการใช้งาน