

EUR/USD's structure has been deteriorating for several weeks and Friday's payroll-driven break of support has only added fuel to the move. Let's take a look at why the pair is beginning to staircase lower and what traders may be watching next.
Strong US Data Gives the Dollar a Boost
Friday's non-farm payrolls report came in comfortably ahead of expectations, reinforcing the view that the US economy remains more resilient than many investors had anticipated. The stronger labour market data prompted traders to dial back expectations for near-term Federal Reserve rate cuts, helping Treasury yields and the US dollar move higher.
While one economic release rarely changes the bigger picture on its own, it can often act as the catalyst that pushes an already vulnerable market through an important technical level. That appears to be exactly what happened on Friday.
The Staircase Effect Begins to Take Shape
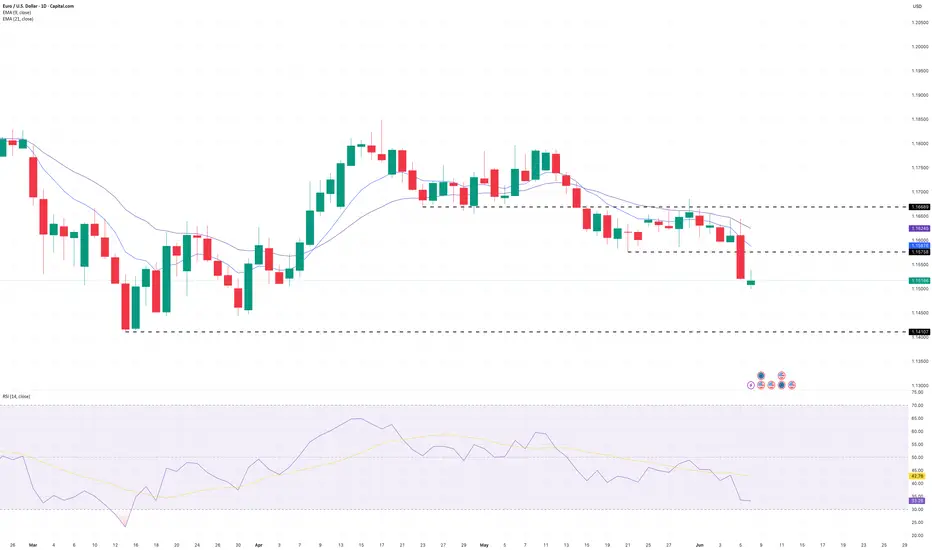
The technical picture has been gradually weakening since EUR/USD topped out in April. Initially the market was simply producing lower highs, but a closer look at the structure shows something equally important happening beneath the surface. Each time support has broken, that former support level has subsequently acted as resistance during the next rally attempt.
That sequence is beginning to create a staircase effect on the daily chart. Price breaks support, rallies back into the area, fails, and then moves lower again. If we connect the major swing highs that have formed during this period, we can also see that bearish momentum is starting to accelerate, with each recovery becoming shorter than the last.
Friday's sell-off added another step to that staircase. The support zone that had repeatedly held throughout late May and early June finally gave way following the stronger-than-expected payrolls report. For now, attention shifts towards whether that broken support area can once again cap any recovery attempts. Swing traders looking to align themselves with the deteriorating daily structure may be watching for lower timeframe pullbacks or consolidation patterns to develop, rather than chasing an already extended move lower.
EUR/USD Daily Candle Chart

Past performance is not a reliable indicator of future results
EUR/USD Four-Hour Candle Chart

Past performance is not a reliable indicator of future results
Disclaimer: This is for information and learning purposes only. The information provided does not constitute investment advice nor take into account the individual financial circumstances or objectives of any investor. Any information that may be provided relating to past performance is not a reliable indicator of future results or performance. Social media channels are not relevant for UK residents.
Spread bets and CFDs are complex instruments and come with a high risk of losing money rapidly due to leverage. 78.48% of retail investor accounts lose money when trading spread bets and CFDs with this provider. You should consider whether you understand how spread bets and CFDs work and whether you can afford to take the high risk of losing your money.
Strong US Data Gives the Dollar a Boost
Friday's non-farm payrolls report came in comfortably ahead of expectations, reinforcing the view that the US economy remains more resilient than many investors had anticipated. The stronger labour market data prompted traders to dial back expectations for near-term Federal Reserve rate cuts, helping Treasury yields and the US dollar move higher.
While one economic release rarely changes the bigger picture on its own, it can often act as the catalyst that pushes an already vulnerable market through an important technical level. That appears to be exactly what happened on Friday.
The Staircase Effect Begins to Take Shape
The technical picture has been gradually weakening since EUR/USD topped out in April. Initially the market was simply producing lower highs, but a closer look at the structure shows something equally important happening beneath the surface. Each time support has broken, that former support level has subsequently acted as resistance during the next rally attempt.
That sequence is beginning to create a staircase effect on the daily chart. Price breaks support, rallies back into the area, fails, and then moves lower again. If we connect the major swing highs that have formed during this period, we can also see that bearish momentum is starting to accelerate, with each recovery becoming shorter than the last.
Friday's sell-off added another step to that staircase. The support zone that had repeatedly held throughout late May and early June finally gave way following the stronger-than-expected payrolls report. For now, attention shifts towards whether that broken support area can once again cap any recovery attempts. Swing traders looking to align themselves with the deteriorating daily structure may be watching for lower timeframe pullbacks or consolidation patterns to develop, rather than chasing an already extended move lower.
EUR/USD Daily Candle Chart
Past performance is not a reliable indicator of future results
EUR/USD Four-Hour Candle Chart
Past performance is not a reliable indicator of future results
Disclaimer: This is for information and learning purposes only. The information provided does not constitute investment advice nor take into account the individual financial circumstances or objectives of any investor. Any information that may be provided relating to past performance is not a reliable indicator of future results or performance. Social media channels are not relevant for UK residents.
Spread bets and CFDs are complex instruments and come with a high risk of losing money rapidly due to leverage. 78.48% of retail investor accounts lose money when trading spread bets and CFDs with this provider. You should consider whether you understand how spread bets and CFDs work and whether you can afford to take the high risk of losing your money.

คำจำกัดสิทธิ์ความรับผิดชอบ
ข้อมูลและบทความไม่ได้มีวัตถุประสงค์เพื่อก่อให้เกิดกิจกรรมทางการเงิน, การลงทุน, การซื้อขาย, ข้อเสนอแนะ หรือคำแนะนำประเภทอื่น ๆ ที่ให้หรือรับรองโดย TradingView อ่านเพิ่มเติมใน ข้อกำหนดการใช้งาน
คำจำกัดสิทธิ์ความรับผิดชอบ
ข้อมูลและบทความไม่ได้มีวัตถุประสงค์เพื่อก่อให้เกิดกิจกรรมทางการเงิน, การลงทุน, การซื้อขาย, ข้อเสนอแนะ หรือคำแนะนำประเภทอื่น ๆ ที่ให้หรือรับรองโดย TradingView อ่านเพิ่มเติมใน ข้อกำหนดการใช้งาน