

What does happened the last October, 8 - 2007 ?
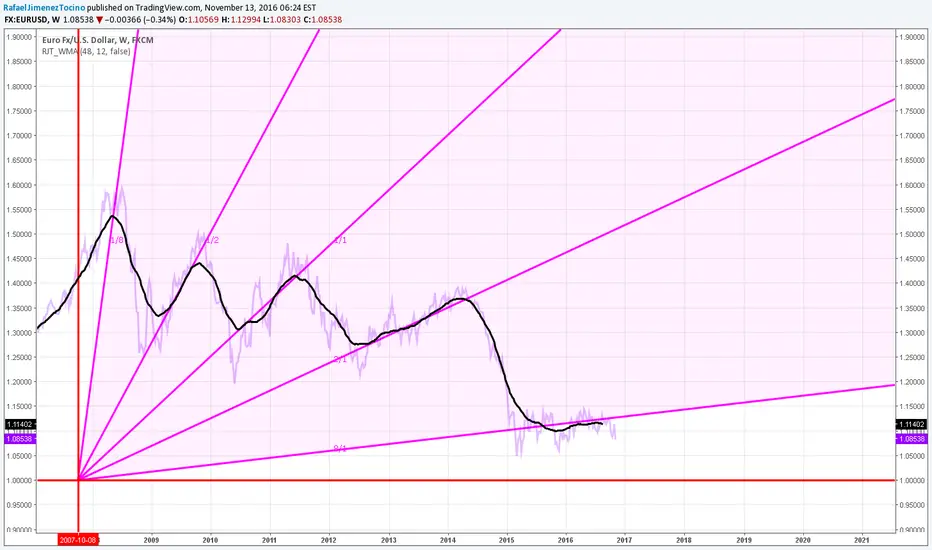
Here you can see a weekly chart of Eur & Usd showing a Gann Fan tool in this date at the level of 1 usd.
The close price is expressed by a Weighted Moving average (48 bars/weeks and a offset of 12 bars/weeks)
As you can see, the division lines 1/8 and 1/2 of Gann Fan Tool perfectly match that the trends marked as that average.
surprising coincidence or something else?
Here you can see a weekly chart of Eur & Usd showing a Gann Fan tool in this date at the level of 1 usd.
The close price is expressed by a Weighted Moving average (48 bars/weeks and a offset of 12 bars/weeks)
As you can see, the division lines 1/8 and 1/2 of Gann Fan Tool perfectly match that the trends marked as that average.
surprising coincidence or something else?
บันทึก
Ok, as the chart is weekly the event is not a exact day date.The question can be ...
What does happened during the first half of October-2007 ?

การนำเสนอที่เกี่ยวข้อง
คำจำกัดสิทธิ์ความรับผิดชอบ
ข้อมูลและบทความไม่ได้มีวัตถุประสงค์เพื่อก่อให้เกิดกิจกรรมทางการเงิน, การลงทุน, การซื้อขาย, ข้อเสนอแนะ หรือคำแนะนำประเภทอื่น ๆ ที่ให้หรือรับรองโดย TradingView อ่านเพิ่มเติมใน ข้อกำหนดการใช้งาน
การนำเสนอที่เกี่ยวข้อง
คำจำกัดสิทธิ์ความรับผิดชอบ
ข้อมูลและบทความไม่ได้มีวัตถุประสงค์เพื่อก่อให้เกิดกิจกรรมทางการเงิน, การลงทุน, การซื้อขาย, ข้อเสนอแนะ หรือคำแนะนำประเภทอื่น ๆ ที่ให้หรือรับรองโดย TradingView อ่านเพิ่มเติมใน ข้อกำหนดการใช้งาน