

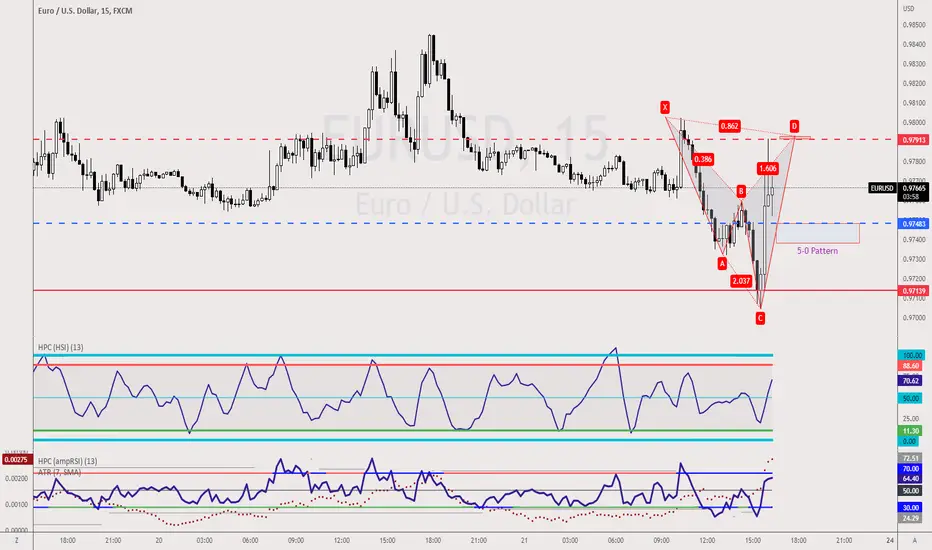
Well, if you guys are aware, I do not usually post an analysis based on M15 timeframe, but this setup is worth watching. The distance between the red and blue line is 43pips, substantial profit between the 2 levels.
On the red dotted line, come the completion of the Bearish Shark Pattern and the blue dotted line, Bullish 5-0 Pattern.
Candlestick Pattern confirmation is required before one consider it as an trading ideas.
p/s do your own analysis and never follow blindly
On the red dotted line, come the completion of the Bearish Shark Pattern and the blue dotted line, Bullish 5-0 Pattern.
Candlestick Pattern confirmation is required before one consider it as an trading ideas.
p/s do your own analysis and never follow blindly

🧑🏫Analysis now at Substack
🕒 Work 15mins to earn additional income
🏦 Qualify Financial Analyst within 90days
🎤 Keynote Speaker
🧠 21yrs in trading
🚀 Get into our Discord to receive our live market analysis!
discord.gg/AKDr9vPqH7
🕒 Work 15mins to earn additional income
🏦 Qualify Financial Analyst within 90days
🎤 Keynote Speaker
🧠 21yrs in trading
🚀 Get into our Discord to receive our live market analysis!
discord.gg/AKDr9vPqH7
คำจำกัดสิทธิ์ความรับผิดชอบ
ข้อมูลและบทความไม่ได้มีวัตถุประสงค์เพื่อก่อให้เกิดกิจกรรมทางการเงิน, การลงทุน, การซื้อขาย, ข้อเสนอแนะ หรือคำแนะนำประเภทอื่น ๆ ที่ให้หรือรับรองโดย TradingView อ่านเพิ่มเติมใน ข้อกำหนดการใช้งาน
🧑🏫Analysis now at Substack
🕒 Work 15mins to earn additional income
🏦 Qualify Financial Analyst within 90days
🎤 Keynote Speaker
🧠 21yrs in trading
🚀 Get into our Discord to receive our live market analysis!
discord.gg/AKDr9vPqH7
🕒 Work 15mins to earn additional income
🏦 Qualify Financial Analyst within 90days
🎤 Keynote Speaker
🧠 21yrs in trading
🚀 Get into our Discord to receive our live market analysis!
discord.gg/AKDr9vPqH7
คำจำกัดสิทธิ์ความรับผิดชอบ
ข้อมูลและบทความไม่ได้มีวัตถุประสงค์เพื่อก่อให้เกิดกิจกรรมทางการเงิน, การลงทุน, การซื้อขาย, ข้อเสนอแนะ หรือคำแนะนำประเภทอื่น ๆ ที่ให้หรือรับรองโดย TradingView อ่านเพิ่มเติมใน ข้อกำหนดการใช้งาน