

Hi Traders
Price action's playing out as analyzed last week, so here's a quick one.
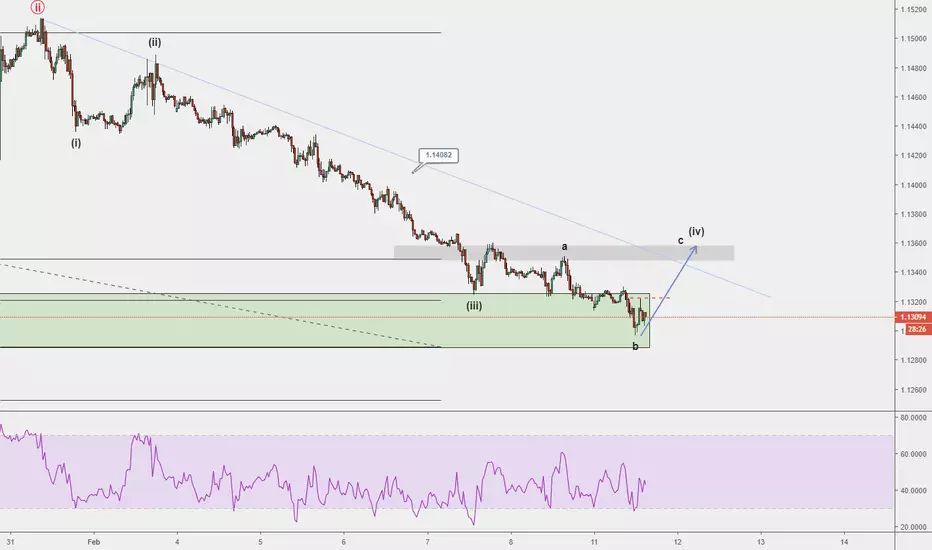
*Price has also hit our daily support zone coloured green
* Candlestick patterns at 11/02/19-12:30 showed a possible trend reversal.
* Price seems to have completed a wave (i) - (iii) on 7/02/19, therefore we are anticipating a wave c of (iv) completion around 1.13519
Price action's playing out as analyzed last week, so here's a quick one.
*Price has also hit our daily support zone coloured green
* Candlestick patterns at 11/02/19-12:30 showed a possible trend reversal.
* Price seems to have completed a wave (i) - (iii) on 7/02/19, therefore we are anticipating a wave c of (iv) completion around 1.13519
บันทึก
Hi Traders,I guess the counts failed so it was best to stick to the predominant trend and just observe the correction play out

การนำเสนอที่เกี่ยวข้อง
คำจำกัดสิทธิ์ความรับผิดชอบ
ข้อมูลและบทความไม่ได้มีวัตถุประสงค์เพื่อก่อให้เกิดกิจกรรมทางการเงิน, การลงทุน, การซื้อขาย, ข้อเสนอแนะ หรือคำแนะนำประเภทอื่น ๆ ที่ให้หรือรับรองโดย TradingView อ่านเพิ่มเติมใน ข้อกำหนดการใช้งาน
การนำเสนอที่เกี่ยวข้อง
คำจำกัดสิทธิ์ความรับผิดชอบ
ข้อมูลและบทความไม่ได้มีวัตถุประสงค์เพื่อก่อให้เกิดกิจกรรมทางการเงิน, การลงทุน, การซื้อขาย, ข้อเสนอแนะ หรือคำแนะนำประเภทอื่น ๆ ที่ให้หรือรับรองโดย TradingView อ่านเพิ่มเติมใน ข้อกำหนดการใช้งาน