

---
📈 EUR/USD Weekly Chart – Wave 4 in Progress?
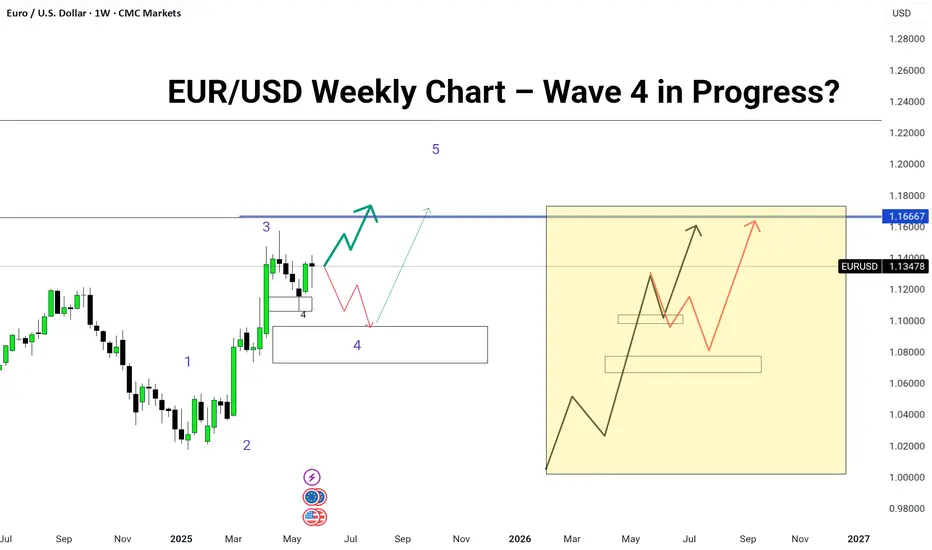
Wave 3 looks complete and price is now hovering in a key correction zone, hinting at the start of Wave 4.
Two possible paths are unfolding:
🔴 Scenario 1: Shallow Wave 4 correction → breakout to Wave 5, targeting 1.16667 and beyond.
🔵 Scenario 2: Deeper Wave 4 correction → retest of demand zone near 1.08, followed by a strong Wave 5 rally.
🧠 Elliott Wave traders, it’s time to stay sharp!
The reaction near the mid-box and support zone could define the next major move for the Euro.
💬 What’s your bias here — is this the start of Wave 5 or a fakeout before a deeper drop?
Comment your view 👇
#EURUSD #ElliottWave #ForexWeekly #GreenFireForex #WaveAnalysis #TechnicalAnalysis #SupplyAndDemand
---

การนำเสนอที่เกี่ยวข้อง
คำจำกัดสิทธิ์ความรับผิดชอบ
ข้อมูลและบทความไม่ได้มีวัตถุประสงค์เพื่อก่อให้เกิดกิจกรรมทางการเงิน, การลงทุน, การซื้อขาย, ข้อเสนอแนะ หรือคำแนะนำประเภทอื่น ๆ ที่ให้หรือรับรองโดย TradingView อ่านเพิ่มเติมใน ข้อกำหนดการใช้งาน
การนำเสนอที่เกี่ยวข้อง
คำจำกัดสิทธิ์ความรับผิดชอบ
ข้อมูลและบทความไม่ได้มีวัตถุประสงค์เพื่อก่อให้เกิดกิจกรรมทางการเงิน, การลงทุน, การซื้อขาย, ข้อเสนอแนะ หรือคำแนะนำประเภทอื่น ๆ ที่ให้หรือรับรองโดย TradingView อ่านเพิ่มเติมใน ข้อกำหนดการใช้งาน