ที่อัปเดต:
META
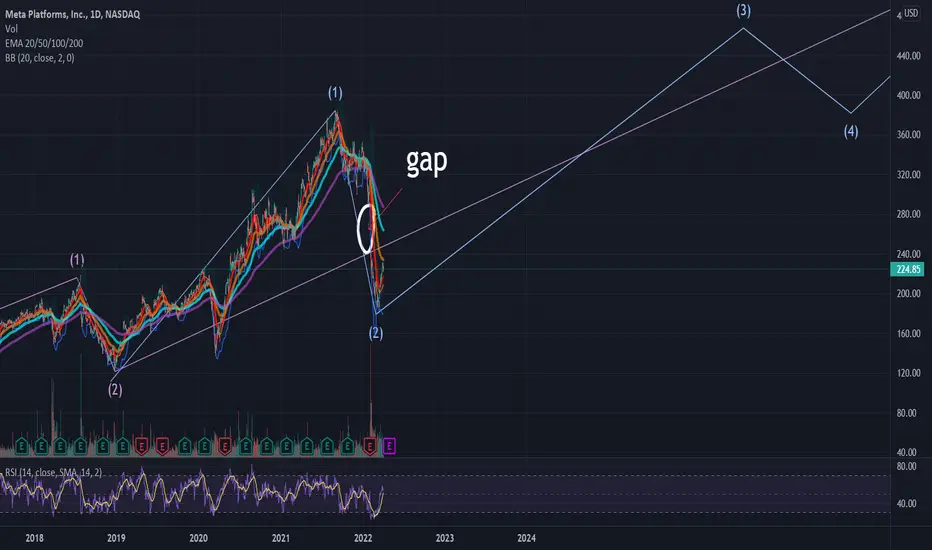
Testing/tracking elliot wave theory. Please do not trade off idea without S/L. Not financial advice.
There's a huge gap around $245-285. I don't normally chart stocks so I have no idea on how long this chart may take to play out.
There's a huge gap around $245-285. I don't normally chart stocks so I have no idea on how long this chart may take to play out.
การซื้อขายยังคงดำเนินอยู่
Chart update from the daily to weekly. I've added macro counts and changed the purple wave to green. Recently we touched the oversold area in which we haven't been at since 2013. The last time we were here, we went up for another 6 years. History often repeat itself, will it happen again? 
คำจำกัดสิทธิ์ความรับผิดชอบ
ข้อมูลและบทความไม่ได้มีวัตถุประสงค์เพื่อก่อให้เกิดกิจกรรมทางการเงิน, การลงทุน, การซื้อขาย, ข้อเสนอแนะ หรือคำแนะนำประเภทอื่น ๆ ที่ให้หรือรับรองโดย TradingView อ่านเพิ่มเติมใน ข้อกำหนดการใช้งาน
คำจำกัดสิทธิ์ความรับผิดชอบ
ข้อมูลและบทความไม่ได้มีวัตถุประสงค์เพื่อก่อให้เกิดกิจกรรมทางการเงิน, การลงทุน, การซื้อขาย, ข้อเสนอแนะ หรือคำแนะนำประเภทอื่น ๆ ที่ให้หรือรับรองโดย TradingView อ่านเพิ่มเติมใน ข้อกำหนดการใช้งาน