FB (Meta) - Recovery Along Trend Line
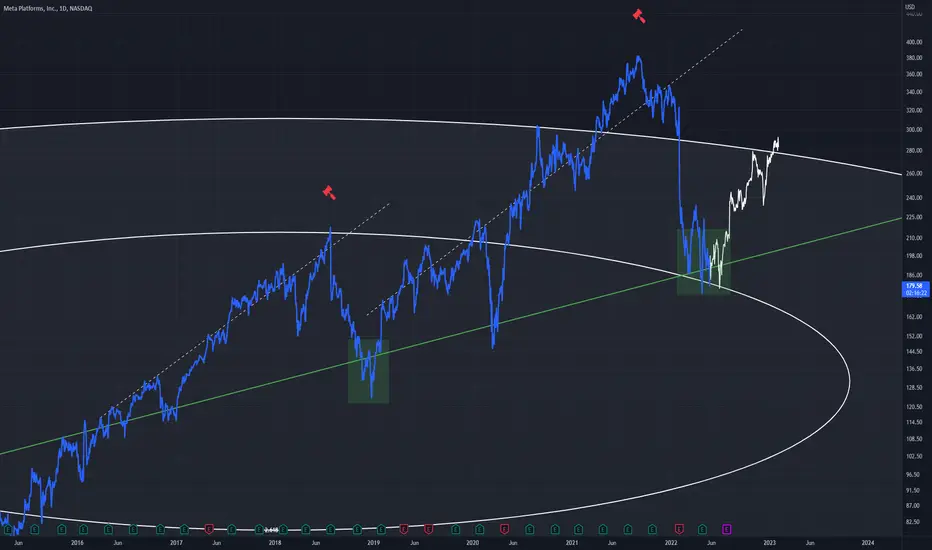
Similarities can be seen between the first dotted upward trend leading to a rejection, and the second also leading to a rejection
Both retrace to the same uptrend
This is the daily chart, with the first rejection at 2.618 and the second at 4.618
Good buy potential on this daily timeframe
Both retrace to the same uptrend
This is the daily chart, with the first rejection at 2.618 and the second at 4.618
Good buy potential on this daily timeframe

คำจำกัดสิทธิ์ความรับผิดชอบ
ข้อมูลและบทความไม่ได้มีวัตถุประสงค์เพื่อก่อให้เกิดกิจกรรมทางการเงิน, การลงทุน, การซื้อขาย, ข้อเสนอแนะ หรือคำแนะนำประเภทอื่น ๆ ที่ให้หรือรับรองโดย TradingView อ่านเพิ่มเติมใน ข้อกำหนดการใช้งาน
คำจำกัดสิทธิ์ความรับผิดชอบ
ข้อมูลและบทความไม่ได้มีวัตถุประสงค์เพื่อก่อให้เกิดกิจกรรมทางการเงิน, การลงทุน, การซื้อขาย, ข้อเสนอแนะ หรือคำแนะนำประเภทอื่น ๆ ที่ให้หรือรับรองโดย TradingView อ่านเพิ่มเติมใน ข้อกำหนดการใช้งาน