
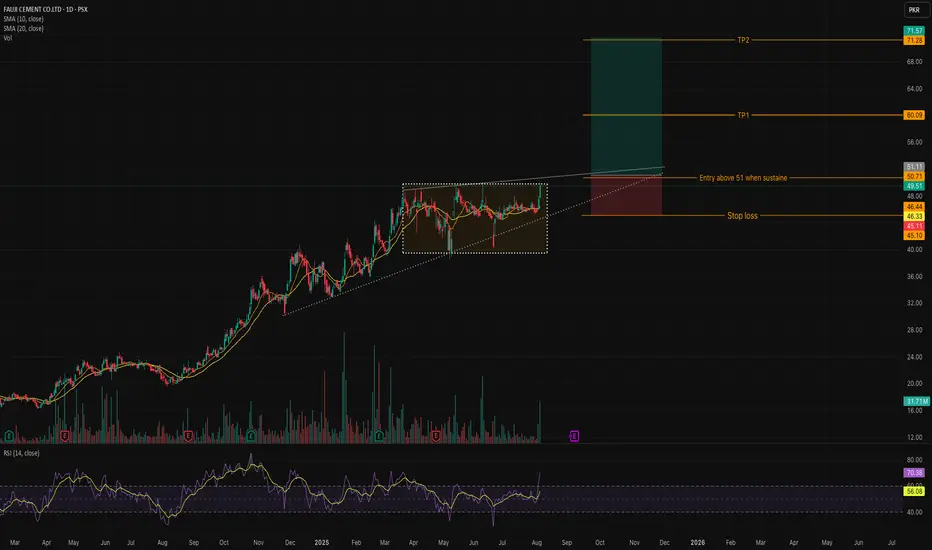
Pattern: Ascending Triangle | Timeframe: 1D | Sector: Cement
After weeks of consolidation, FCCL is finally knocking on the resistance door. With strong volume and momentum, a breakout could unlock serious upside potential! 📈
🔍 Setup Overview:
✅ Breakout Level: 51.11 – Key resistance to watch. Entry on sustained close above this level.
🟢 Current Price: 49.51 – Just below breakout zone.
💡 Indicators:
RSI at 70.38 – Entering overbought territory, showing bullish momentum.
SMA(10) and SMA(20) support the trend.
🎯 Trade Plan:
📥 Entry: Above 51.11 (on confirmed breakout)
🛑 Stop Loss: 45.10 – Below structure support and SMA cluster
🎯 Target 1 (TP1): 60.09
🎯 Target 2 (TP2): 71.57
This gives a strong risk-reward ratio, ideal for swing traders.
การซื้อขายยังคงดำเนินอยู่
TP1 hit, Trail your SL to breakeven, and ride for Tp2 
คำจำกัดสิทธิ์ความรับผิดชอบ
ข้อมูลและบทความไม่ได้มีวัตถุประสงค์เพื่อก่อให้เกิดกิจกรรมทางการเงิน, การลงทุน, การซื้อขาย, ข้อเสนอแนะ หรือคำแนะนำประเภทอื่น ๆ ที่ให้หรือรับรองโดย TradingView อ่านเพิ่มเติมใน ข้อกำหนดการใช้งาน
คำจำกัดสิทธิ์ความรับผิดชอบ
ข้อมูลและบทความไม่ได้มีวัตถุประสงค์เพื่อก่อให้เกิดกิจกรรมทางการเงิน, การลงทุน, การซื้อขาย, ข้อเสนอแนะ หรือคำแนะนำประเภทอื่น ๆ ที่ให้หรือรับรองโดย TradingView อ่านเพิ่มเติมใน ข้อกำหนดการใช้งาน