
FET/USDT – Chart Update
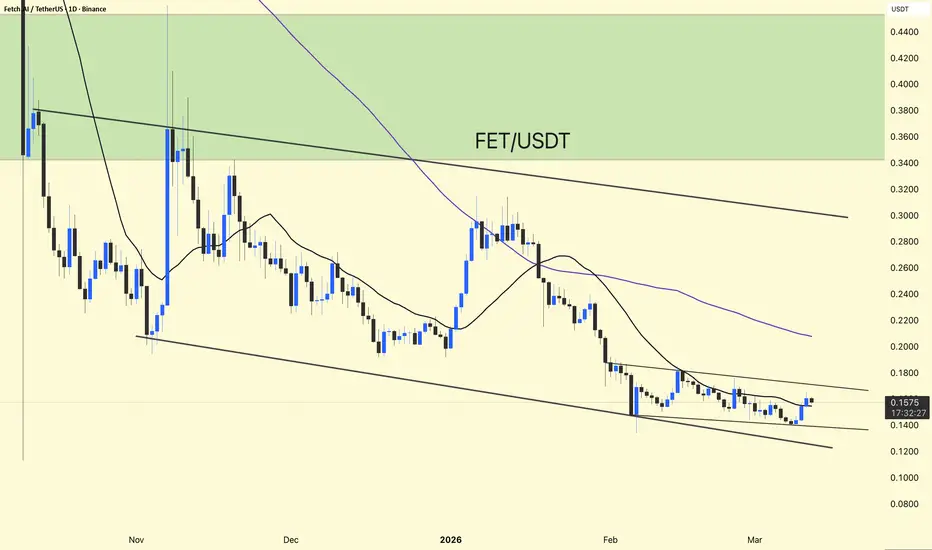
FET is currently trading around $0.157, moving inside a descending channel structure.
Price is holding near the lower channel support, where buyers are starting to step in.
The recent bounce suggests short-term recovery, but the trend is still bearish until resistance breaks.
The upper channel trendline near $0.17–$0.18 is acting as immediate resistance.
Bullish Scenario:
If FET breaks above $0.18, the next potential targets could be:
$0.22
$0.26
Bearish Scenario:
If the price loses the $0.14 support, the downside may extend toward:
$0.12
$0.10 support zone
FET is attempting a short-term bounce from channel support, but a break above $0.18 is needed to confirm stronger bullish momentum.
DYOR | NFA
FET is currently trading around $0.157, moving inside a descending channel structure.
Price is holding near the lower channel support, where buyers are starting to step in.
The recent bounce suggests short-term recovery, but the trend is still bearish until resistance breaks.
The upper channel trendline near $0.17–$0.18 is acting as immediate resistance.
Bullish Scenario:
If FET breaks above $0.18, the next potential targets could be:
$0.22
$0.26
Bearish Scenario:
If the price loses the $0.14 support, the downside may extend toward:
$0.12
$0.10 support zone
FET is attempting a short-term bounce from channel support, but a break above $0.18 is needed to confirm stronger bullish momentum.
DYOR | NFA

การนำเสนอที่เกี่ยวข้อง
คำจำกัดสิทธิ์ความรับผิดชอบ
ข้อมูลและบทความไม่ได้มีวัตถุประสงค์เพื่อก่อให้เกิดกิจกรรมทางการเงิน, การลงทุน, การซื้อขาย, ข้อเสนอแนะ หรือคำแนะนำประเภทอื่น ๆ ที่ให้หรือรับรองโดย TradingView อ่านเพิ่มเติมใน ข้อกำหนดการใช้งาน
การนำเสนอที่เกี่ยวข้อง
คำจำกัดสิทธิ์ความรับผิดชอบ
ข้อมูลและบทความไม่ได้มีวัตถุประสงค์เพื่อก่อให้เกิดกิจกรรมทางการเงิน, การลงทุน, การซื้อขาย, ข้อเสนอแนะ หรือคำแนะนำประเภทอื่น ๆ ที่ให้หรือรับรองโดย TradingView อ่านเพิ่มเติมใน ข้อกำหนดการใช้งาน