
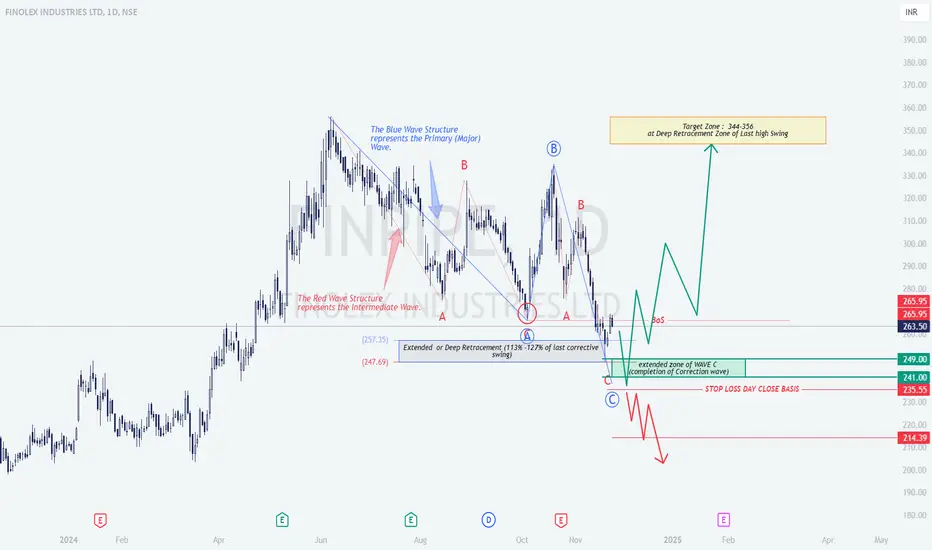
Finolex Industries Ltd: Wave Structure and Fibonacci Confluence Analysis
1. Overview
This chart analysis of Finolex Industries Ltd leverages Elliott Wave Theory and Fibonacci retracement zones to identify high-probability price movements. It captures the interaction of a primary wave (blue) and an intermediate wave (red), providing insight into the potential price reversal and future targets.
2. Technical Breakdown
Wave B: Forms a minor retracement, lacking strong upward momentum.
Wave C: Extended downward move, aligning with the critical retracement zone of 113%–127% Fibonacci.
3. Logical Interpretation of Price Action
4. Strategy Recommendations
Entry Points:
Targets:
Stop-Loss:
Alternative Scenario:
5. Educational Insights
6. Summary
This analysis of Finolex Industries Ltd combines Elliott Wave Theory and Fibonacci retracements to outline a potential bullish scenario. The setup offers a clear risk-reward strategy for traders, emphasizing key zones like the ₹241–₹249 support area and the ₹344–₹356 target zone. Adopting disciplined risk management with stop-loss placement ensures effective trade execution in a volatile market.
1. Overview
This chart analysis of Finolex Industries Ltd leverages Elliott Wave Theory and Fibonacci retracement zones to identify high-probability price movements. It captures the interaction of a primary wave (blue) and an intermediate wave (red), providing insight into the potential price reversal and future targets.
2. Technical Breakdown
Wave B: Forms a minor retracement, lacking strong upward momentum.
Wave C: Extended downward move, aligning with the critical retracement zone of 113%–127% Fibonacci.
3. Logical Interpretation of Price Action
4. Strategy Recommendations
Entry Points:
Targets:
Stop-Loss:
Alternative Scenario:
5. Educational Insights
6. Summary
This analysis of Finolex Industries Ltd combines Elliott Wave Theory and Fibonacci retracements to outline a potential bullish scenario. The setup offers a clear risk-reward strategy for traders, emphasizing key zones like the ₹241–₹249 support area and the ₹344–₹356 target zone. Adopting disciplined risk management with stop-loss placement ensures effective trade execution in a volatile market.

คำจำกัดสิทธิ์ความรับผิดชอบ
ข้อมูลและบทความไม่ได้มีวัตถุประสงค์เพื่อก่อให้เกิดกิจกรรมทางการเงิน, การลงทุน, การซื้อขาย, ข้อเสนอแนะ หรือคำแนะนำประเภทอื่น ๆ ที่ให้หรือรับรองโดย TradingView อ่านเพิ่มเติมใน ข้อกำหนดการใช้งาน
คำจำกัดสิทธิ์ความรับผิดชอบ
ข้อมูลและบทความไม่ได้มีวัตถุประสงค์เพื่อก่อให้เกิดกิจกรรมทางการเงิน, การลงทุน, การซื้อขาย, ข้อเสนอแนะ หรือคำแนะนำประเภทอื่น ๆ ที่ให้หรือรับรองโดย TradingView อ่านเพิ่มเติมใน ข้อกำหนดการใช้งาน