
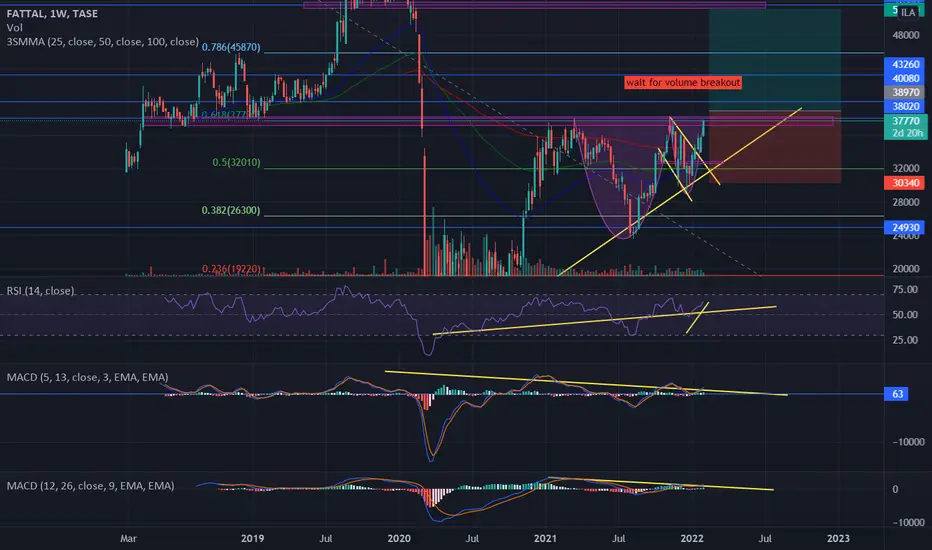
Perfect cup and handle.
waiting for the resistance and the 0.618 fib to break, and the weekly + monthly candlsticks close above resistance.
50 ema in monthly chart will break now, after few rejects.
In weekly chart all ema failed to reject.
I estimate 30% growth to the next month:)
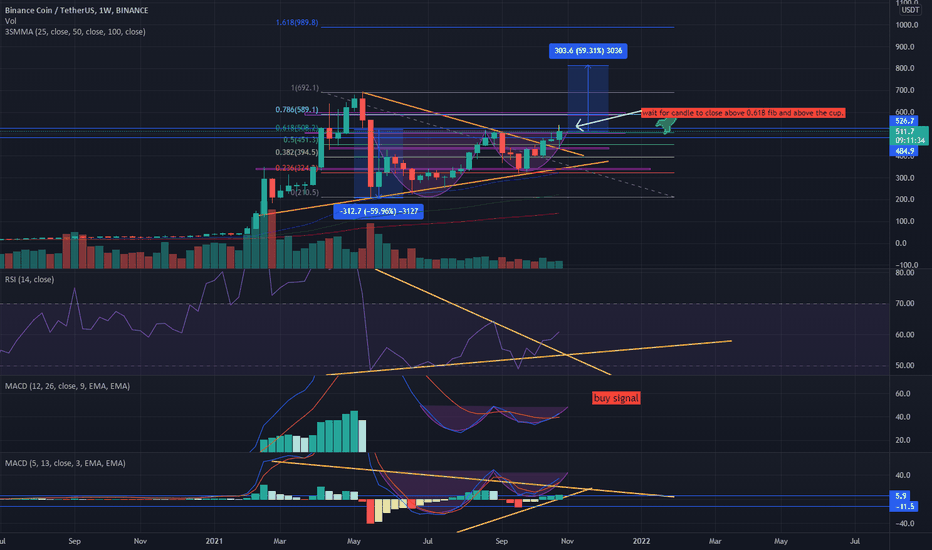
In the past I TA very similar BNBUSDT weekly chart and the growth wasn't late to come.
The chart:
FTAL monthly chart:

waiting for the resistance and the 0.618 fib to break, and the weekly + monthly candlsticks close above resistance.
50 ema in monthly chart will break now, after few rejects.
In weekly chart all ema failed to reject.
I estimate 30% growth to the next month:)
In the past I TA very similar BNBUSDT weekly chart and the growth wasn't late to come.
The chart:
FTAL monthly chart:

การนำเสนอที่เกี่ยวข้อง
คำจำกัดสิทธิ์ความรับผิดชอบ
ข้อมูลและบทความไม่ได้มีวัตถุประสงค์เพื่อก่อให้เกิดกิจกรรมทางการเงิน, การลงทุน, การซื้อขาย, ข้อเสนอแนะ หรือคำแนะนำประเภทอื่น ๆ ที่ให้หรือรับรองโดย TradingView อ่านเพิ่มเติมใน ข้อกำหนดการใช้งาน
การนำเสนอที่เกี่ยวข้อง
คำจำกัดสิทธิ์ความรับผิดชอบ
ข้อมูลและบทความไม่ได้มีวัตถุประสงค์เพื่อก่อให้เกิดกิจกรรมทางการเงิน, การลงทุน, การซื้อขาย, ข้อเสนอแนะ หรือคำแนะนำประเภทอื่น ๆ ที่ให้หรือรับรองโดย TradingView อ่านเพิ่มเติมใน ข้อกำหนดการใช้งาน