Long
🔥 FTM Potential Falling Wedge Break Out
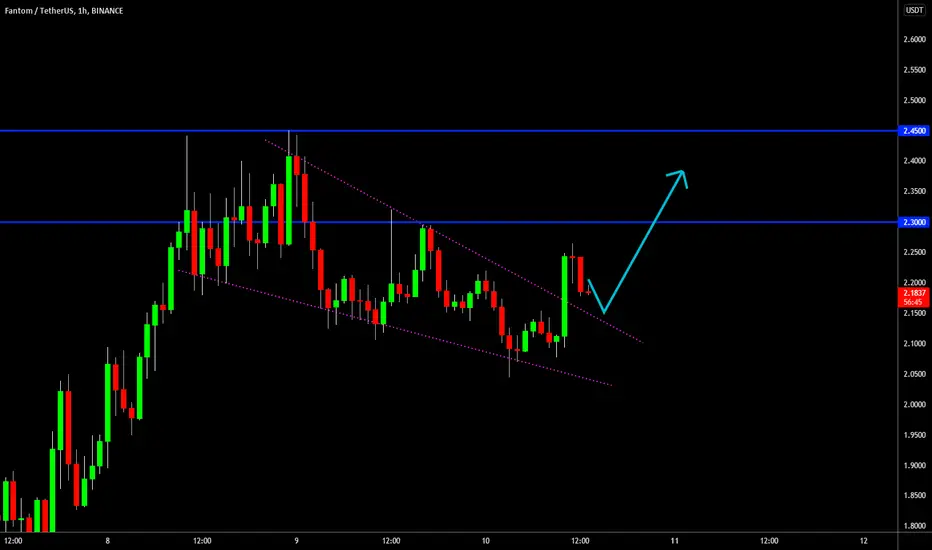
After a massive move last week, FTM has cooled off a little. During this period of cooling down, a falling wedge pattern has emerged on the chart.
Classically, falling wedges are bullish break out patterns. As of this morning, the break out has indeed occurred. Be aware that the top trend line might need to be re-tested to confirm the break out.
First target is placed at the recent local high, $2.30, second at the all-time-high, $2.45.
Happy trading!
Classically, falling wedges are bullish break out patterns. As of this morning, the break out has indeed occurred. Be aware that the top trend line might need to be re-tested to confirm the break out.
First target is placed at the recent local high, $2.30, second at the all-time-high, $2.45.
Happy trading!

🎯Official Channel: t.me/FieryTradingChannel
📈Try my Premium Signals for FREE - 80% Win-Rate: t.me/FT_Futures_free
✅Monster Signals: t.me/monster_cryptosignals
🔥Premium Signals: fierytrading.com
📈Try my Premium Signals for FREE - 80% Win-Rate: t.me/FT_Futures_free
✅Monster Signals: t.me/monster_cryptosignals
🔥Premium Signals: fierytrading.com
การนำเสนอที่เกี่ยวข้อง
คำจำกัดสิทธิ์ความรับผิดชอบ
ข้อมูลและบทความไม่ได้มีวัตถุประสงค์เพื่อก่อให้เกิดกิจกรรมทางการเงิน, การลงทุน, การซื้อขาย, ข้อเสนอแนะ หรือคำแนะนำประเภทอื่น ๆ ที่ให้หรือรับรองโดย TradingView อ่านเพิ่มเติมใน ข้อกำหนดการใช้งาน
🎯Official Channel: t.me/FieryTradingChannel
📈Try my Premium Signals for FREE - 80% Win-Rate: t.me/FT_Futures_free
✅Monster Signals: t.me/monster_cryptosignals
🔥Premium Signals: fierytrading.com
📈Try my Premium Signals for FREE - 80% Win-Rate: t.me/FT_Futures_free
✅Monster Signals: t.me/monster_cryptosignals
🔥Premium Signals: fierytrading.com
การนำเสนอที่เกี่ยวข้อง
คำจำกัดสิทธิ์ความรับผิดชอบ
ข้อมูลและบทความไม่ได้มีวัตถุประสงค์เพื่อก่อให้เกิดกิจกรรมทางการเงิน, การลงทุน, การซื้อขาย, ข้อเสนอแนะ หรือคำแนะนำประเภทอื่น ๆ ที่ให้หรือรับรองโดย TradingView อ่านเพิ่มเติมใน ข้อกำหนดการใช้งาน