
📈 GAL (Ghandhara Automobiles Ltd) – Technical Observation | Bullish Structure
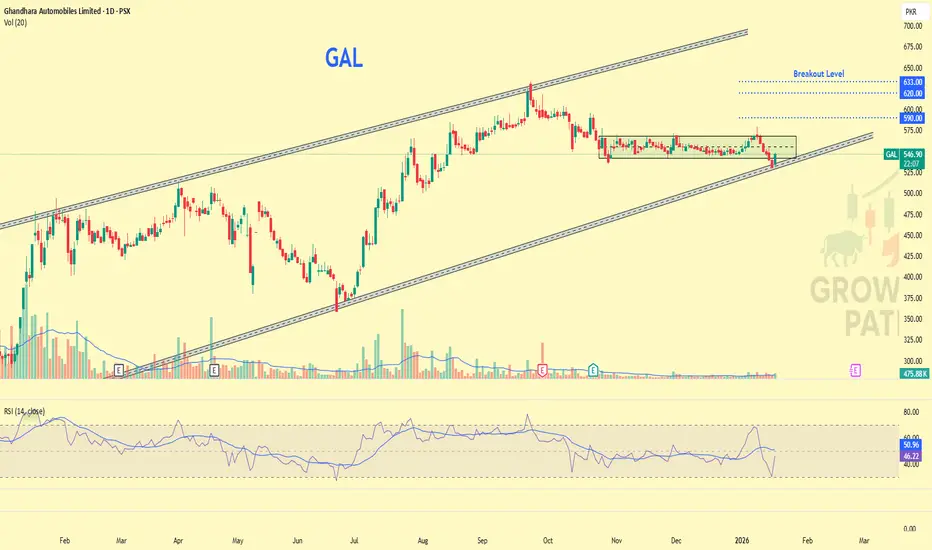
GAL is maintaining a higher highs and higher lows market structure, indicating a healthy uptrend. After a controlled pullback, price has reacted positively from the rising trendline support, suggesting buyers are still active.
At the time of observation, price is trading around 547, where a short-term reaction from support is visible.
🔹 Key Technical Levels:
• 570 acted as a strong accumulation and resistance zone
— A decisive breakout with strong momentum above this level may open the path for further upside continuation.
🎯 Potential Upside Zones (if breakout sustains):
• 590
• 620
🚀 633 is a major structural breakout level. A sustained move above this level could indicate trend acceleration.
📊 Overall bias remains bullish as long as price holds above the ascending channel support.
📚 This analysis is for educational purposes only and reflects technical observations, not a trading recommendation.
GAL is maintaining a higher highs and higher lows market structure, indicating a healthy uptrend. After a controlled pullback, price has reacted positively from the rising trendline support, suggesting buyers are still active.
At the time of observation, price is trading around 547, where a short-term reaction from support is visible.
🔹 Key Technical Levels:
• 570 acted as a strong accumulation and resistance zone
— A decisive breakout with strong momentum above this level may open the path for further upside continuation.
🎯 Potential Upside Zones (if breakout sustains):
• 590
• 620
🚀 633 is a major structural breakout level. A sustained move above this level could indicate trend acceleration.
📊 Overall bias remains bullish as long as price holds above the ascending channel support.
📚 This analysis is for educational purposes only and reflects technical observations, not a trading recommendation.

คำจำกัดสิทธิ์ความรับผิดชอบ
ข้อมูลและบทความไม่ได้มีวัตถุประสงค์เพื่อก่อให้เกิดกิจกรรมทางการเงิน, การลงทุน, การซื้อขาย, ข้อเสนอแนะ หรือคำแนะนำประเภทอื่น ๆ ที่ให้หรือรับรองโดย TradingView อ่านเพิ่มเติมใน ข้อกำหนดการใช้งาน
คำจำกัดสิทธิ์ความรับผิดชอบ
ข้อมูลและบทความไม่ได้มีวัตถุประสงค์เพื่อก่อให้เกิดกิจกรรมทางการเงิน, การลงทุน, การซื้อขาย, ข้อเสนอแนะ หรือคำแนะนำประเภทอื่น ๆ ที่ให้หรือรับรองโดย TradingView อ่านเพิ่มเติมใน ข้อกำหนดการใช้งาน