
#GALA/USDT
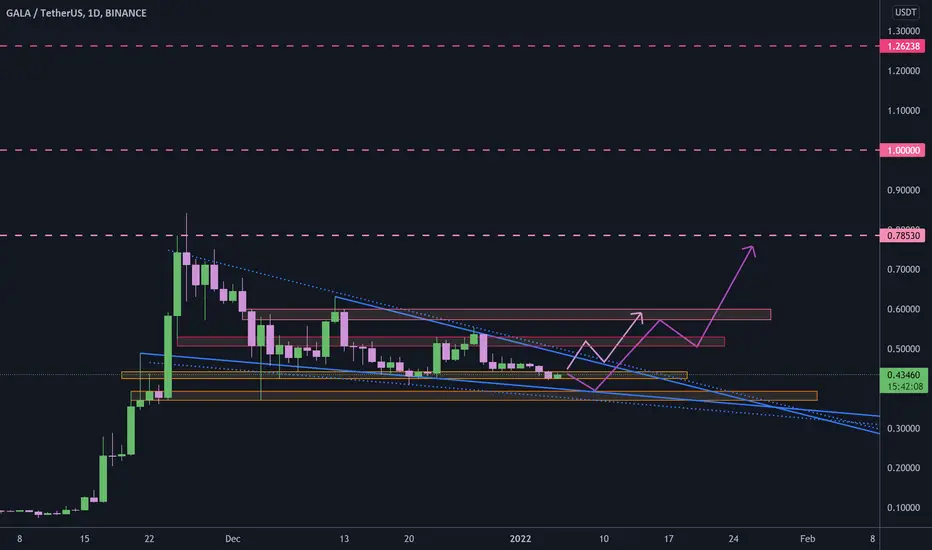
GGALA is inside falling wedge pattern, and now is at support zone that if hold it and head up to break out the upper line of wedge it can increase to touch resistance zone around $0.57 and $0.6.
it is possible that price drop to touch the lower line of wedge, then start its rally to break out from wedge.
in long term #GALA can increase toward $1.
break below the lower line of wedge that is the same with long term support zone around $0.3692 will invalid this analysis.
GGALA is inside falling wedge pattern, and now is at support zone that if hold it and head up to break out the upper line of wedge it can increase to touch resistance zone around $0.57 and $0.6.
it is possible that price drop to touch the lower line of wedge, then start its rally to break out from wedge.
in long term #GALA can increase toward $1.
break below the lower line of wedge that is the same with long term support zone around $0.3692 will invalid this analysis.

การนำเสนอที่เกี่ยวข้อง
คำจำกัดสิทธิ์ความรับผิดชอบ
ข้อมูลและบทความไม่ได้มีวัตถุประสงค์เพื่อก่อให้เกิดกิจกรรมทางการเงิน, การลงทุน, การซื้อขาย, ข้อเสนอแนะ หรือคำแนะนำประเภทอื่น ๆ ที่ให้หรือรับรองโดย TradingView อ่านเพิ่มเติมใน ข้อกำหนดการใช้งาน
การนำเสนอที่เกี่ยวข้อง
คำจำกัดสิทธิ์ความรับผิดชอบ
ข้อมูลและบทความไม่ได้มีวัตถุประสงค์เพื่อก่อให้เกิดกิจกรรมทางการเงิน, การลงทุน, การซื้อขาย, ข้อเสนอแนะ หรือคำแนะนำประเภทอื่น ๆ ที่ให้หรือรับรองโดย TradingView อ่านเพิ่มเติมใน ข้อกำหนดการใช้งาน