
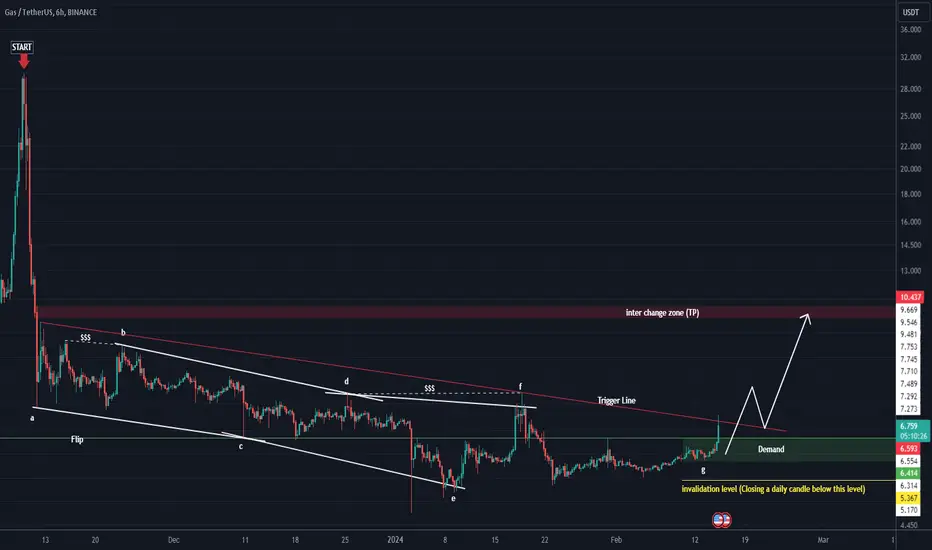
From where we entered "START" on the chart, it looks like a correction has started.
Examining the waves, it looks like a diametric is over.
There is a nice support range on the chart, and by maintaining this range, GAS can be pumped to sweep the liquidity pools.
Closing a daily candle below the invalidatio level will violate the analysis.
For risk management, please don't forget stop loss and capital management
Comment if you have any questions
Thank You
Examining the waves, it looks like a diametric is over.
There is a nice support range on the chart, and by maintaining this range, GAS can be pumped to sweep the liquidity pools.
Closing a daily candle below the invalidatio level will violate the analysis.
For risk management, please don't forget stop loss and capital management
Comment if you have any questions
Thank You

✅ Join our Telegram channel to succeed in trading.
💎Our CRYPTO Telegram Channel: 👉 t.me/Behdark_EN
💎Our FOREX Telegram Channel: 👉 t.me/FX_Behdark
💎Our CRYPTO Telegram Channel: 👉 t.me/Behdark_EN
💎Our FOREX Telegram Channel: 👉 t.me/FX_Behdark
คำจำกัดสิทธิ์ความรับผิดชอบ
ข้อมูลและบทความไม่ได้มีวัตถุประสงค์เพื่อก่อให้เกิดกิจกรรมทางการเงิน, การลงทุน, การซื้อขาย, ข้อเสนอแนะ หรือคำแนะนำประเภทอื่น ๆ ที่ให้หรือรับรองโดย TradingView อ่านเพิ่มเติมใน ข้อกำหนดการใช้งาน
✅ Join our Telegram channel to succeed in trading.
💎Our CRYPTO Telegram Channel: 👉 t.me/Behdark_EN
💎Our FOREX Telegram Channel: 👉 t.me/FX_Behdark
💎Our CRYPTO Telegram Channel: 👉 t.me/Behdark_EN
💎Our FOREX Telegram Channel: 👉 t.me/FX_Behdark
คำจำกัดสิทธิ์ความรับผิดชอบ
ข้อมูลและบทความไม่ได้มีวัตถุประสงค์เพื่อก่อให้เกิดกิจกรรมทางการเงิน, การลงทุน, การซื้อขาย, ข้อเสนอแนะ หรือคำแนะนำประเภทอื่น ๆ ที่ให้หรือรับรองโดย TradingView อ่านเพิ่มเติมใน ข้อกำหนดการใช้งาน