

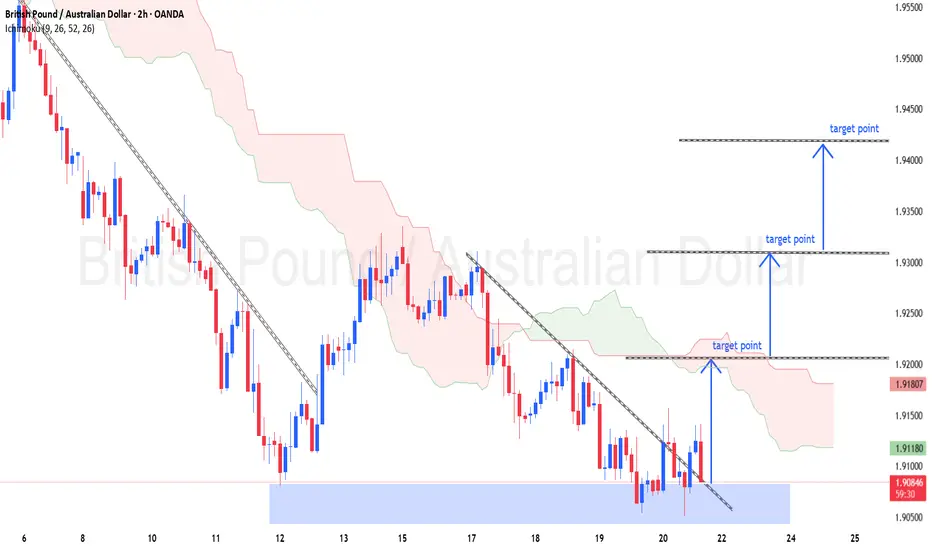
GBPAUD – 2H CHART.
(based on MY chart) 📈
Market has reacted from strong demand zone and broken the descending trendline, so upside continuation is expected.
🎯 Target 1 (TP1): 1.9200
🎯 Target 2 (TP2): 1.9300
🎯 Target 3 (TP3): 1.9400
Bias: Bullish
Reason:
Break & close above downtrend line
Bounce from demand zone
Ichimoku cloud resistance aligned with targets.
การซื้อขายยังคงดำเนินอยู่
active trades 
📲 Join telegram channel free .
t.me/addlist/7jtN1zcz9W05MDVk
Forex, Gold & Crypto Signals with detailed analysis & get consistent results.
Gold Signal's with proper TP & SL for high profit opportunities.
t.me/addlist/7jtN1zcz9W05MDVk
Forex, Gold & Crypto Signals with detailed analysis & get consistent results.
Gold Signal's with proper TP & SL for high profit opportunities.
การนำเสนอที่เกี่ยวข้อง
คำจำกัดสิทธิ์ความรับผิดชอบ
ข้อมูลและบทความไม่ได้มีวัตถุประสงค์เพื่อก่อให้เกิดกิจกรรมทางการเงิน, การลงทุน, การซื้อขาย, ข้อเสนอแนะ หรือคำแนะนำประเภทอื่น ๆ ที่ให้หรือรับรองโดย TradingView อ่านเพิ่มเติมใน ข้อกำหนดการใช้งาน