
 GBPUSD
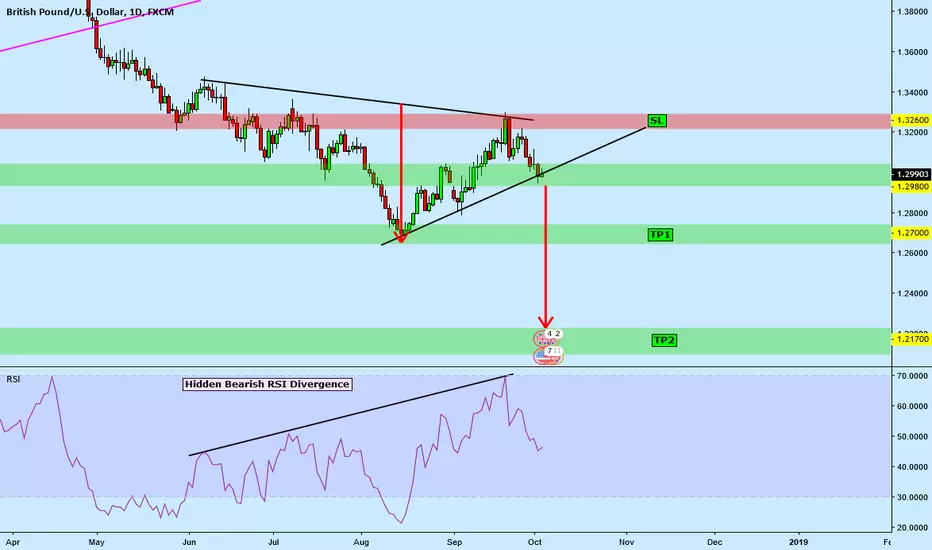
There's a Hidden RSI Bearish Divergence on the Daily Chart indicating a possible downtrend continuation.
A break below and daily candle close below the trendline and we may see price go as low as ~1.21700 ( Previous Low of March)
Short Entry: At close of Daily Candle below trendline
TP 1: 1.27000
TP 2: 1.21700
SL: 1.32600
This is longterm trade. Take profits as you wish.
บันทึก
บันทึก
TP 1: 1.27000 reached
คำจำกัดสิทธิ์ความรับผิดชอบ
ข้อมูลและบทความไม่ได้มีวัตถุประสงค์เพื่อก่อให้เกิดกิจกรรมทางการเงิน, การลงทุน, การซื้อขาย, ข้อเสนอแนะ หรือคำแนะนำประเภทอื่น ๆ ที่ให้หรือรับรองโดย TradingView อ่านเพิ่มเติมใน ข้อกำหนดการใช้งาน
คำจำกัดสิทธิ์ความรับผิดชอบ
ข้อมูลและบทความไม่ได้มีวัตถุประสงค์เพื่อก่อให้เกิดกิจกรรมทางการเงิน, การลงทุน, การซื้อขาย, ข้อเสนอแนะ หรือคำแนะนำประเภทอื่น ๆ ที่ให้หรือรับรองโดย TradingView อ่านเพิ่มเติมใน ข้อกำหนดการใช้งาน