

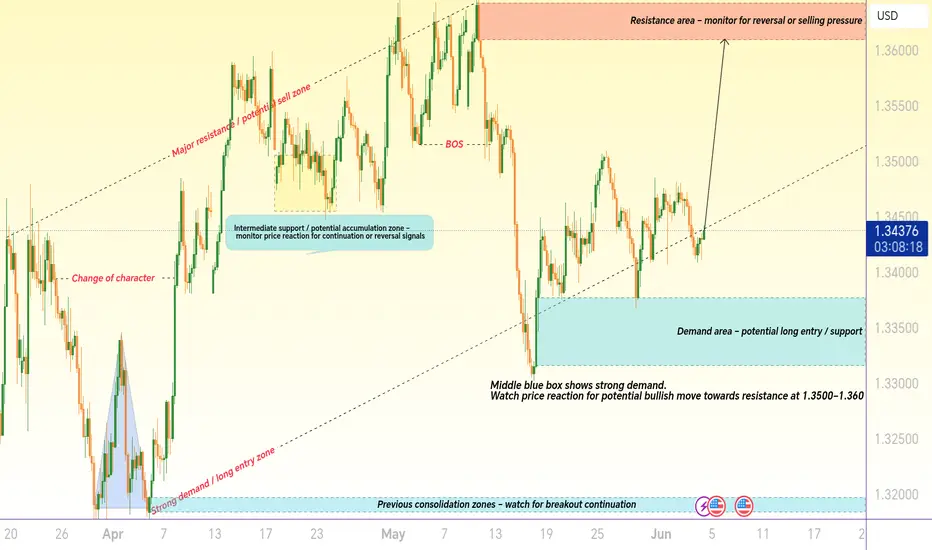
This chart highlights crucial GBP/USD levels, including major support zones and key resistance areas. Blue rectangles indicate demand zones where buyers may step in, while orange rectangles show resistance and potential sell zones. Trendlines indicate the market direction, and horizontal lines mark target levels for entries, stop-losses, and profit-taking. Traders can use these levels to plan structured short-term or swing trades

t.me/+QuPClHzEaLwwNTBk
What You'll Get:
Daily Forex signals with high accuracy
Technical & fundamental analysis
Risk management tips to protect your capital
Join now and start winning
t.me/+QuPClHzEaLwwNTBk
What You'll Get:
Daily Forex signals with high accuracy
Technical & fundamental analysis
Risk management tips to protect your capital
Join now and start winning
t.me/+QuPClHzEaLwwNTBk
การนำเสนอที่เกี่ยวข้อง
คำจำกัดสิทธิ์ความรับผิดชอบ
ข้อมูลและบทความไม่ได้มีวัตถุประสงค์เพื่อก่อให้เกิดกิจกรรมทางการเงิน, การลงทุน, การซื้อขาย, ข้อเสนอแนะ หรือคำแนะนำประเภทอื่น ๆ ที่ให้หรือรับรองโดย TradingView อ่านเพิ่มเติมใน ข้อกำหนดการใช้งาน
t.me/+QuPClHzEaLwwNTBk
What You'll Get:
Daily Forex signals with high accuracy
Technical & fundamental analysis
Risk management tips to protect your capital
Join now and start winning
t.me/+QuPClHzEaLwwNTBk
What You'll Get:
Daily Forex signals with high accuracy
Technical & fundamental analysis
Risk management tips to protect your capital
Join now and start winning
t.me/+QuPClHzEaLwwNTBk
การนำเสนอที่เกี่ยวข้อง
คำจำกัดสิทธิ์ความรับผิดชอบ
ข้อมูลและบทความไม่ได้มีวัตถุประสงค์เพื่อก่อให้เกิดกิจกรรมทางการเงิน, การลงทุน, การซื้อขาย, ข้อเสนอแนะ หรือคำแนะนำประเภทอื่น ๆ ที่ให้หรือรับรองโดย TradingView อ่านเพิ่มเติมใน ข้อกำหนดการใช้งาน