

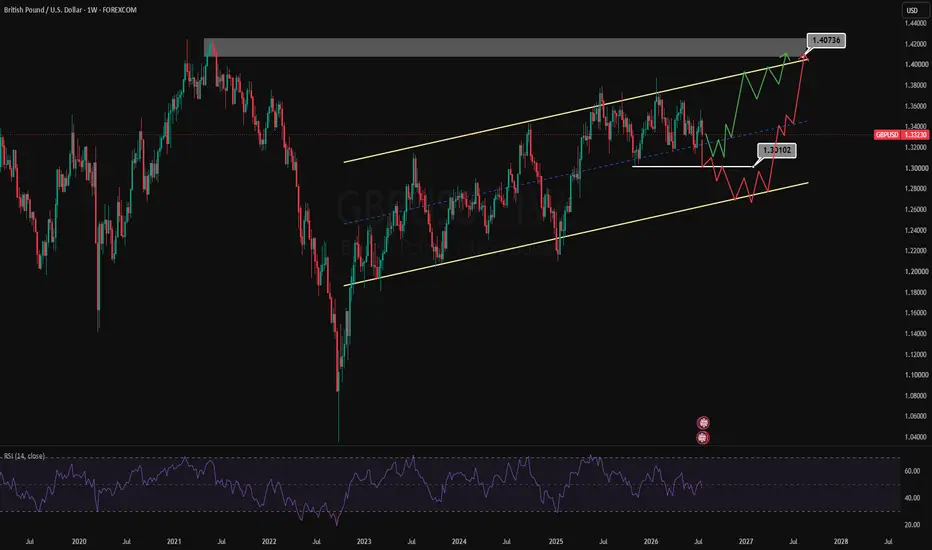
The GBP/USD pair has been trading within a weekly ascending channel since November 2022, and price is currently approaching the midline of the channel, a level that could determine the next major move.
📉 Bearish Scenario
If the channel's midline, together with the key weekly support at 1.30102, is broken with a confirmed weekly close below the level, the probability of a deeper correction increases significantly. In that scenario, price could continue its decline toward the lower boundary of the ascending channel.
📈 Bullish Scenario
On the other hand, if the 1.30102 support level holds and buyers successfully defend this area, GBP/USD may regain bullish momentum and move back toward the upper boundary of the channel, with 1.40736 acting as the primary upside target.
🌍 Fundamental Outlook
From a macroeconomic perspective, if the Federal Reserve maintains a restrictive monetary policy and market expectations continue to favor a stronger U.S. Dollar, the bearish scenario and a move toward the lower boundary of the channel would become more likely than the bullish alternative.
«Disclaimer: This analysis is based on the current technical structure and prevailing macroeconomic conditions. Future economic data, central bank policy decisions, or a break of key technical levels may invalidate this outlook.»
#GBPUSD #Forex #TechnicalAnalysis #FundamentalAnalysis #GBP #USD #Fed #PriceAction #WeeklyChart #Trading
📉 Bearish Scenario
If the channel's midline, together with the key weekly support at 1.30102, is broken with a confirmed weekly close below the level, the probability of a deeper correction increases significantly. In that scenario, price could continue its decline toward the lower boundary of the ascending channel.
📈 Bullish Scenario
On the other hand, if the 1.30102 support level holds and buyers successfully defend this area, GBP/USD may regain bullish momentum and move back toward the upper boundary of the channel, with 1.40736 acting as the primary upside target.
🌍 Fundamental Outlook
From a macroeconomic perspective, if the Federal Reserve maintains a restrictive monetary policy and market expectations continue to favor a stronger U.S. Dollar, the bearish scenario and a move toward the lower boundary of the channel would become more likely than the bullish alternative.
«Disclaimer: This analysis is based on the current technical structure and prevailing macroeconomic conditions. Future economic data, central bank policy decisions, or a break of key technical levels may invalidate this outlook.»
#GBPUSD #Forex #TechnicalAnalysis #FundamentalAnalysis #GBP #USD #Fed #PriceAction #WeeklyChart #Trading

คำจำกัดสิทธิ์ความรับผิดชอบ
ข้อมูลและบทความไม่ได้มีวัตถุประสงค์เพื่อก่อให้เกิดกิจกรรมทางการเงิน, การลงทุน, การซื้อขาย, ข้อเสนอแนะ หรือคำแนะนำประเภทอื่น ๆ ที่ให้หรือรับรองโดย TradingView อ่านเพิ่มเติมใน ข้อกำหนดการใช้งาน
คำจำกัดสิทธิ์ความรับผิดชอบ
ข้อมูลและบทความไม่ได้มีวัตถุประสงค์เพื่อก่อให้เกิดกิจกรรมทางการเงิน, การลงทุน, การซื้อขาย, ข้อเสนอแนะ หรือคำแนะนำประเภทอื่น ๆ ที่ให้หรือรับรองโดย TradingView อ่านเพิ่มเติมใน ข้อกำหนดการใช้งาน