

📌 Overview
___________________________________________________________
📘 Definition
___________________________________________________________
📌 Key Points
___________________________________________________________
📊 Chart Explanation
___________________________________________________________
📉 Summary
___________________________________________________________
💡 Why It Matters
___________________________________________________________
📌 Conclusion
___________________________________________________________
⚠️ Disclaimer
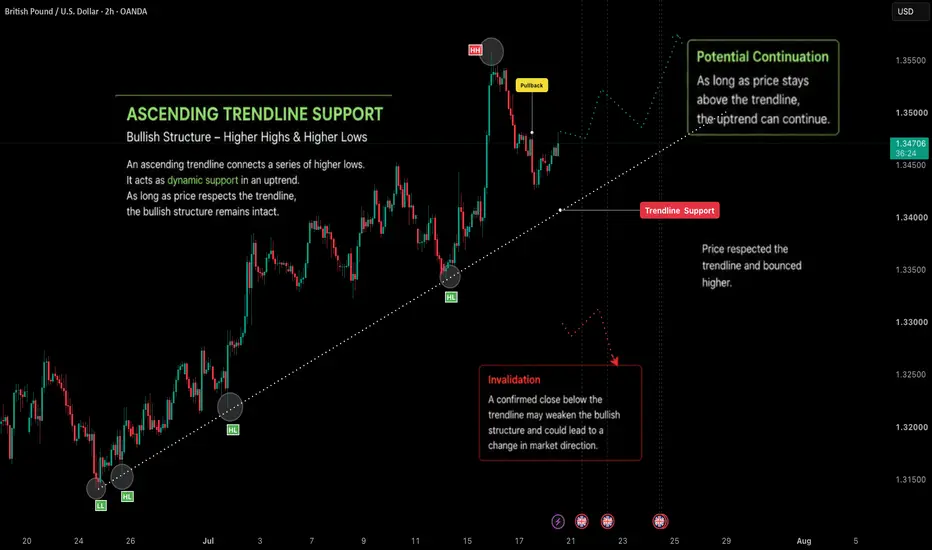
An Ascending Trendline is a technical analysis tool used to identify a series of higher lows during an uptrend. In this chart, price has respected the trendline multiple times, indicating that buyers have continued to defend the rising support area. The latest bounce from the trendline suggests that the current bullish structure remains intact while price stays above this dynamic support.
___________________________________________________________
📘 Definition
An Ascending Trendline is created by connecting two or more higher lows during an uptrend. It acts as dynamic support and helps visualize the direction of the prevailing trend.
• Higher Lows – Each higher low indicates that buyers are stepping in at progressively higher prices.
• Trendline Support – The ascending trendline connects these higher lows and represents a dynamic support level.
• Pullback – Temporary declines toward the trendline are common during an uptrend and may offer insight into market strength.
• Bullish Bounce – A positive reaction from the trendline suggests that buyers continue defending the support zone.
• Higher High – After a successful bounce, price may continue creating higher highs, maintaining the bullish structure.
• Invalidation – A confirmed close below the trendline may weaken the current trend structure and indicate that buying momentum is decreasing.
___________________________________________________________
📌 Key Points
• The trendline connects multiple higher lows.
• Price has respected the trendline on several occasions.
• The latest pullback found support near the trendline.
• As long as price remains above the trendline, the bullish structure remains intact.
• A confirmed break below the trendline may indicate a potential change in market structure.
___________________________________________________________
📊 Chart Explanation
• The chart begins with a series of higher lows, establishing an ascending trendline.
• Price continues making higher highs while respecting the rising support.
• After reaching a new high, price experiences a normal pullback toward the trendline.
• The latest bounce from the trendline demonstrates that buyers continue defending the dynamic support area.
• The projected path illustrates one possible continuation scenario if price continues respecting the trendline. This projection is for educational purposes only and does not predict future market movement.
___________________________________________________________
📉 Summary
This chart demonstrates how an Ascending Trendline can help visualize an uptrend by connecting higher lows. The repeated respect of the trendline highlights continued buying interest, while future price action will determine whether the bullish structure continues or becomes invalidated.
___________________________________________________________
💡 Why It Matters
• Helps identify the direction of the prevailing trend.
• Highlights dynamic support levels during an uptrend.
• Encourages traders to wait for price confirmation rather than anticipating moves.
• Can be combined with price action, support and resistance, and other technical tools for additional market context.
___________________________________________________________
📌 Conclusion
Ascending Trendlines provide a simple way to understand market structure and trend direction. Like any technical analysis tool, they are most effective when combined with confirmation and sound risk management rather than being used in isolation.
___________________________________________________________
⚠️ Disclaimer
📘 For educational purposes only.
🙅 Not SEBI registered.
❌ Not a buy/sell recommendation.
🧠 Purely a learning resource.
📊 Not Financial Advice

Pine Script Developer • Market Analysis
คำจำกัดสิทธิ์ความรับผิดชอบ
ข้อมูลและบทความไม่ได้มีวัตถุประสงค์เพื่อก่อให้เกิดกิจกรรมทางการเงิน, การลงทุน, การซื้อขาย, ข้อเสนอแนะ หรือคำแนะนำประเภทอื่น ๆ ที่ให้หรือรับรองโดย TradingView อ่านเพิ่มเติมใน ข้อกำหนดการใช้งาน
Pine Script Developer • Market Analysis
คำจำกัดสิทธิ์ความรับผิดชอบ
ข้อมูลและบทความไม่ได้มีวัตถุประสงค์เพื่อก่อให้เกิดกิจกรรมทางการเงิน, การลงทุน, การซื้อขาย, ข้อเสนอแนะ หรือคำแนะนำประเภทอื่น ๆ ที่ให้หรือรับรองโดย TradingView อ่านเพิ่มเติมใน ข้อกำหนดการใช้งาน