

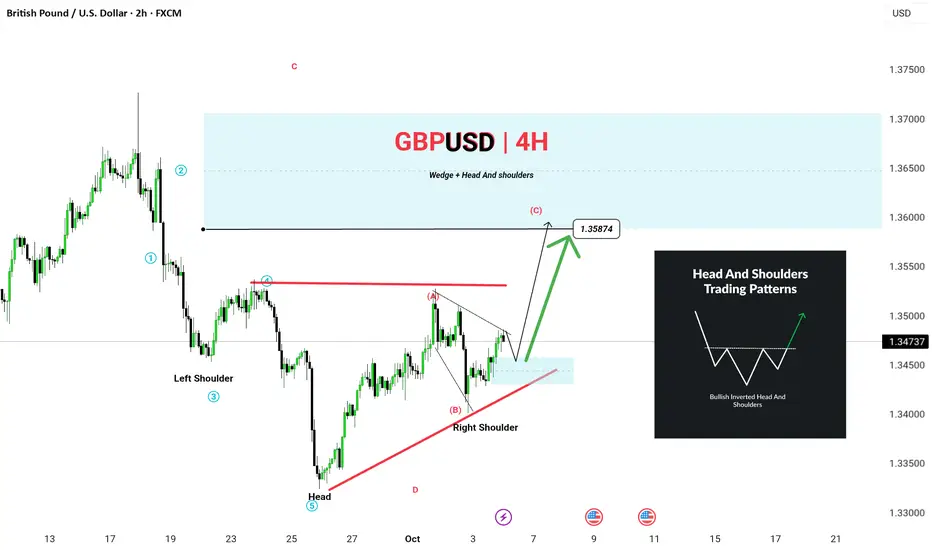
GBP/USD – Wedge Pattern Analysis | GreenfireForex
The GBP/USD (1H timeframe) is currently forming a contracting wedge pattern (A–B–C–D–E), indicating potential price compression before a decisive breakout.
🔹 Key Observations:
The pair is completing wave E, touching the upper wedge resistance.
Price is expected to face selling pressure near the resistance line, forming a short-term corrective move.
A breakout below the wedge could open a move toward the 1.34200–1.33500 demand zone.
However, if buyers defend support, we may see another push back toward 1.35000 before reversal.
📊 Structure Breakdown:
A–C–E → Lower highs (trendline resistance)
B–D → Higher lows (trendline support)
Possible continuation: ABCDE → Breakout
Blue zones mark potential liquidity areas and entry/exit zones.
⚡ Trading Outlook:
Watch for confirmation candles near the E point before positioning. A clean breakout with volume will confirm the next major move.
🧠 Pattern type: Falling wedge (potential bullish reversal)
🕓 Timeframe: 1H
💰 Instrument: GBP/USD
The GBP/USD (1H timeframe) is currently forming a contracting wedge pattern (A–B–C–D–E), indicating potential price compression before a decisive breakout.
🔹 Key Observations:
The pair is completing wave E, touching the upper wedge resistance.
Price is expected to face selling pressure near the resistance line, forming a short-term corrective move.
A breakout below the wedge could open a move toward the 1.34200–1.33500 demand zone.
However, if buyers defend support, we may see another push back toward 1.35000 before reversal.
📊 Structure Breakdown:
A–C–E → Lower highs (trendline resistance)
B–D → Higher lows (trendline support)
Possible continuation: ABCDE → Breakout
Blue zones mark potential liquidity areas and entry/exit zones.
⚡ Trading Outlook:
Watch for confirmation candles near the E point before positioning. A clean breakout with volume will confirm the next major move.
🧠 Pattern type: Falling wedge (potential bullish reversal)
🕓 Timeframe: 1H
💰 Instrument: GBP/USD

การนำเสนอที่เกี่ยวข้อง
คำจำกัดสิทธิ์ความรับผิดชอบ
ข้อมูลและบทความไม่ได้มีวัตถุประสงค์เพื่อก่อให้เกิดกิจกรรมทางการเงิน, การลงทุน, การซื้อขาย, ข้อเสนอแนะ หรือคำแนะนำประเภทอื่น ๆ ที่ให้หรือรับรองโดย TradingView อ่านเพิ่มเติมใน ข้อกำหนดการใช้งาน
การนำเสนอที่เกี่ยวข้อง
คำจำกัดสิทธิ์ความรับผิดชอบ
ข้อมูลและบทความไม่ได้มีวัตถุประสงค์เพื่อก่อให้เกิดกิจกรรมทางการเงิน, การลงทุน, การซื้อขาย, ข้อเสนอแนะ หรือคำแนะนำประเภทอื่น ๆ ที่ให้หรือรับรองโดย TradingView อ่านเพิ่มเติมใน ข้อกำหนดการใช้งาน