

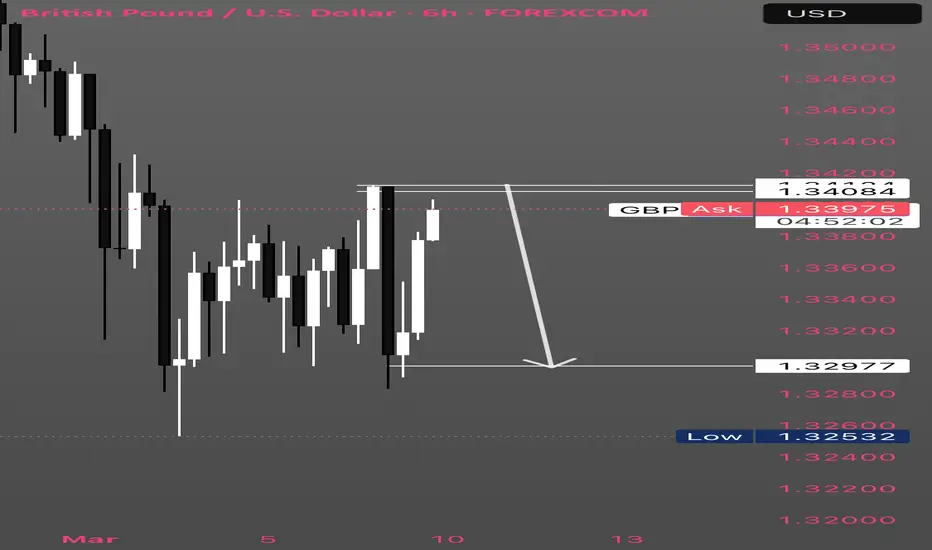
chart for GBP/USD captures a classic bearish setup unfolding from early March 2026, with price action reflecting a sustained downtrend amid weakening the pound.the pair trades at an ask price of 1.3393, down significantly from the session high near 1.3580 and testing lows around 1.3253. This aligns with broader multi-week bearish structure, where GBP/USD has shed over 3% from February highs, breaking key range lows and an ascending trendline.  The chart visually depicts lower highs and lower lows within a descending channel, with a recent breakdown below 1.3400 signaling potential for further downside. Below, I’ll break down the technical, fundamental, and trading implications in detail, emphasizing the bearish case while noting neutral/contrarian elements for balance.
1. Technical Analysis: Clear Bearish Momentum on 4H Timeframe
The chart illustrates a textbook bearish continuation pattern, with price consolidating in a descending channel since March 5. Candles show repeated rejections at the upper channel boundary (around 1.3480–1.3500) and acceleration lower after breaching horizontal support at 1.3400. This isn’t just noise—it’s a structural shift, confirmed by multiple indicators.
• Trend Structure and Price Action:
• Lower Highs/Lows: From the March 5 open near 1.3500, price formed a high at ~1.3580 (early in the period) before carving out progressively lower peaks (e.g., ~1.3440 mid-period) and troughs (dipping to 1.3253 by March 9). The arrow on the chart points to a breakdown below 1.3297, reinforcing the bearish impulse.
• Descending Channel: The parallel lines (visible as the slanted box) connect the swing high at 1.3580 to the recent low, with price hugging the lower boundary. A close below 1.3280 (the channel’s projected lower rail) would invalidate any short-term bounce and target the next support cluster. 
• Broken Trendline: An ascending trendline from February lows (around 1.3200) has been decisively violated, opening the door for a measured move decline of ~470 pips from the 1.3580 high—potentially to 1.3110.  On the 4H, this aligns with a symmetric triangle breakdown earlier in the week, biasing sellers on any retest of 1.3414. 
1. Technical Analysis: Clear Bearish Momentum on 4H Timeframe
The chart illustrates a textbook bearish continuation pattern, with price consolidating in a descending channel since March 5. Candles show repeated rejections at the upper channel boundary (around 1.3480–1.3500) and acceleration lower after breaching horizontal support at 1.3400. This isn’t just noise—it’s a structural shift, confirmed by multiple indicators.
• Trend Structure and Price Action:
• Lower Highs/Lows: From the March 5 open near 1.3500, price formed a high at ~1.3580 (early in the period) before carving out progressively lower peaks (e.g., ~1.3440 mid-period) and troughs (dipping to 1.3253 by March 9). The arrow on the chart points to a breakdown below 1.3297, reinforcing the bearish impulse.
• Descending Channel: The parallel lines (visible as the slanted box) connect the swing high at 1.3580 to the recent low, with price hugging the lower boundary. A close below 1.3280 (the channel’s projected lower rail) would invalidate any short-term bounce and target the next support cluster. 
• Broken Trendline: An ascending trendline from February lows (around 1.3200) has been decisively violated, opening the door for a measured move decline of ~470 pips from the 1.3580 high—potentially to 1.3110.  On the 4H, this aligns with a symmetric triangle breakdown earlier in the week, biasing sellers on any retest of 1.3414. 

คำจำกัดสิทธิ์ความรับผิดชอบ
ข้อมูลและบทความไม่ได้มีวัตถุประสงค์เพื่อก่อให้เกิดกิจกรรมทางการเงิน, การลงทุน, การซื้อขาย, ข้อเสนอแนะ หรือคำแนะนำประเภทอื่น ๆ ที่ให้หรือรับรองโดย TradingView อ่านเพิ่มเติมใน ข้อกำหนดการใช้งาน
คำจำกัดสิทธิ์ความรับผิดชอบ
ข้อมูลและบทความไม่ได้มีวัตถุประสงค์เพื่อก่อให้เกิดกิจกรรมทางการเงิน, การลงทุน, การซื้อขาย, ข้อเสนอแนะ หรือคำแนะนำประเภทอื่น ๆ ที่ให้หรือรับรองโดย TradingView อ่านเพิ่มเติมใน ข้อกำหนดการใช้งาน