

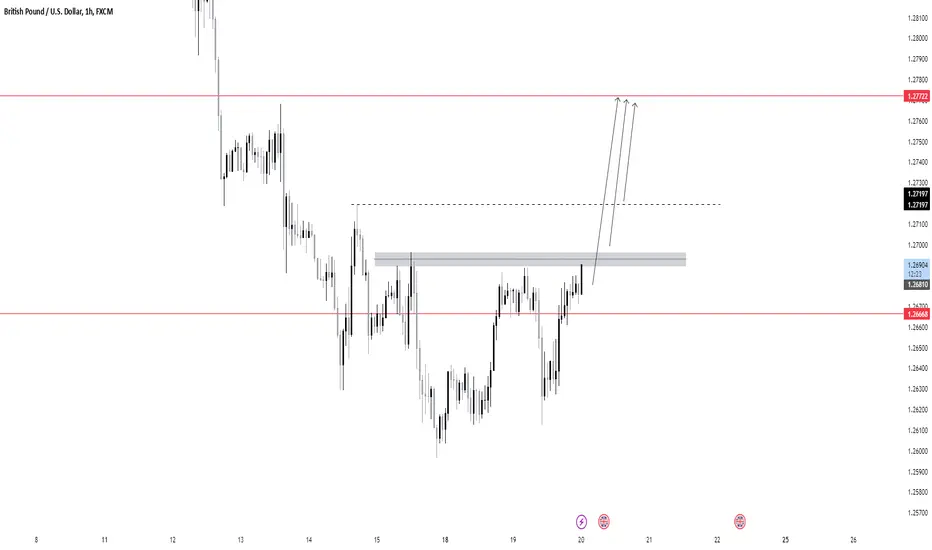
This chart displays the GBP/USD pair on the 1-hour timeframe currently leaning bullish, as the price has shown strength approaching the resistance.
The price is currently testing a key resistance zone around the 1.2689-1.2700 level, with potential bullish momentum indicated by the recent rally.
If the price breaks above the resistance zone and closes beyond 1.2700, it could indicate a continuation toward the next resistance level at 1.2777
The price is currently testing a key resistance zone around the 1.2689-1.2700 level, with potential bullish momentum indicated by the recent rally.
If the price breaks above the resistance zone and closes beyond 1.2700, it could indicate a continuation toward the next resistance level at 1.2777

iSmashProfit
การนำเสนอที่เกี่ยวข้อง
คำจำกัดสิทธิ์ความรับผิดชอบ
ข้อมูลและบทความไม่ได้มีวัตถุประสงค์เพื่อก่อให้เกิดกิจกรรมทางการเงิน, การลงทุน, การซื้อขาย, ข้อเสนอแนะ หรือคำแนะนำประเภทอื่น ๆ ที่ให้หรือรับรองโดย TradingView อ่านเพิ่มเติมใน ข้อกำหนดการใช้งาน
iSmashProfit
การนำเสนอที่เกี่ยวข้อง
คำจำกัดสิทธิ์ความรับผิดชอบ
ข้อมูลและบทความไม่ได้มีวัตถุประสงค์เพื่อก่อให้เกิดกิจกรรมทางการเงิน, การลงทุน, การซื้อขาย, ข้อเสนอแนะ หรือคำแนะนำประเภทอื่น ๆ ที่ให้หรือรับรองโดย TradingView อ่านเพิ่มเติมใน ข้อกำหนดการใช้งาน