
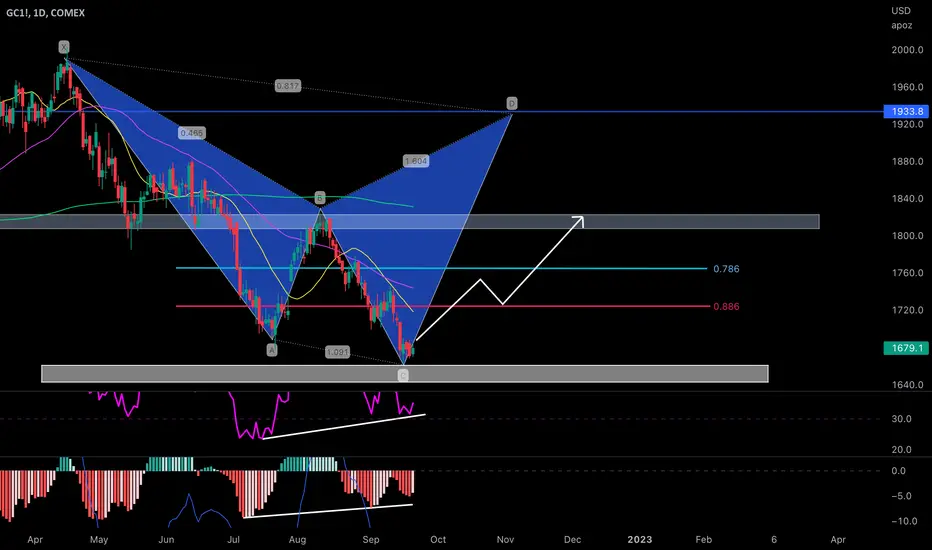
Hey y’all, i charted a possible bullish play that could potentially lead to some upside regarding GS1! Here we potentially have a alternate XABCD that’s below the typical pattern completion zone of the 786 and 886 fib retrace ratios. We are showing Class A Bullish Divergence on both oscillators IEW the RSI and MACD showing seller exhaustion and negative momentum winding down. We may see price action start to make a push upwards and go green in the next coming weeks… just my opinion on a possible outcome..

คำจำกัดสิทธิ์ความรับผิดชอบ
ข้อมูลและบทความไม่ได้มีวัตถุประสงค์เพื่อก่อให้เกิดกิจกรรมทางการเงิน, การลงทุน, การซื้อขาย, ข้อเสนอแนะ หรือคำแนะนำประเภทอื่น ๆ ที่ให้หรือรับรองโดย TradingView อ่านเพิ่มเติมใน ข้อกำหนดการใช้งาน
คำจำกัดสิทธิ์ความรับผิดชอบ
ข้อมูลและบทความไม่ได้มีวัตถุประสงค์เพื่อก่อให้เกิดกิจกรรมทางการเงิน, การลงทุน, การซื้อขาย, ข้อเสนอแนะ หรือคำแนะนำประเภทอื่น ๆ ที่ให้หรือรับรองโดย TradingView อ่านเพิ่มเติมใน ข้อกำหนดการใช้งาน