
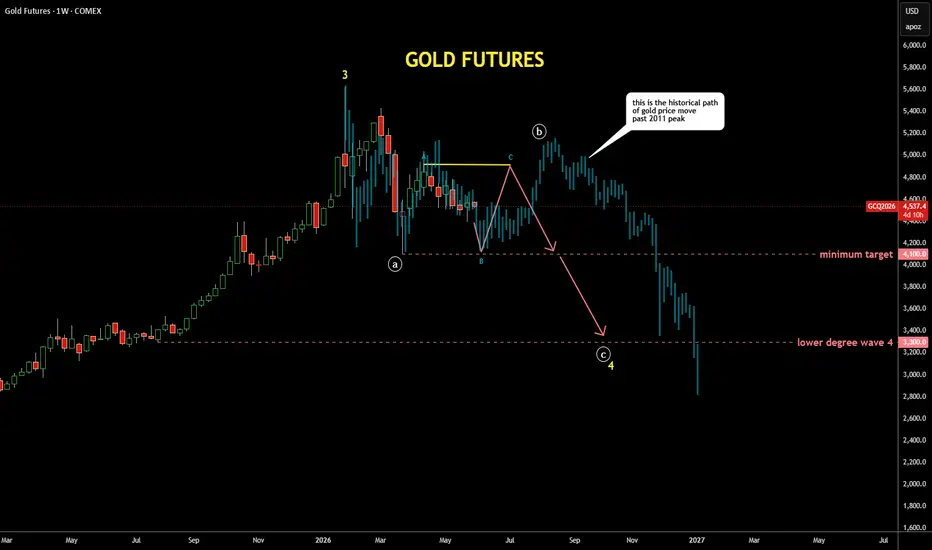
It's quite interesting exercise to check past patterns
if it is applicable to the current price structure
I scrolled back to distant 2011 where the gold peaked around $1,900,
copied the structure from there and pasted to the current peak
I fitted the bar pattern (faded blue bars) with tops and bottoms
It looks similar to the current structure as extremes align almost perfectly
It also matches with the map I posted earlier last week with bit more volatility
if it is applicable to the current price structure
I scrolled back to distant 2011 where the gold peaked around $1,900,
copied the structure from there and pasted to the current peak
I fitted the bar pattern (faded blue bars) with tops and bottoms
It looks similar to the current structure as extremes align almost perfectly
It also matches with the map I posted earlier last week with bit more volatility

การนำเสนอที่เกี่ยวข้อง
คำจำกัดสิทธิ์ความรับผิดชอบ
ข้อมูลและบทความไม่ได้มีวัตถุประสงค์เพื่อก่อให้เกิดกิจกรรมทางการเงิน, การลงทุน, การซื้อขาย, ข้อเสนอแนะ หรือคำแนะนำประเภทอื่น ๆ ที่ให้หรือรับรองโดย TradingView อ่านเพิ่มเติมใน ข้อกำหนดการใช้งาน
การนำเสนอที่เกี่ยวข้อง
คำจำกัดสิทธิ์ความรับผิดชอบ
ข้อมูลและบทความไม่ได้มีวัตถุประสงค์เพื่อก่อให้เกิดกิจกรรมทางการเงิน, การลงทุน, การซื้อขาย, ข้อเสนอแนะ หรือคำแนะนำประเภทอื่น ๆ ที่ให้หรือรับรองโดย TradingView อ่านเพิ่มเติมใน ข้อกำหนดการใช้งาน