
Current Market Overview
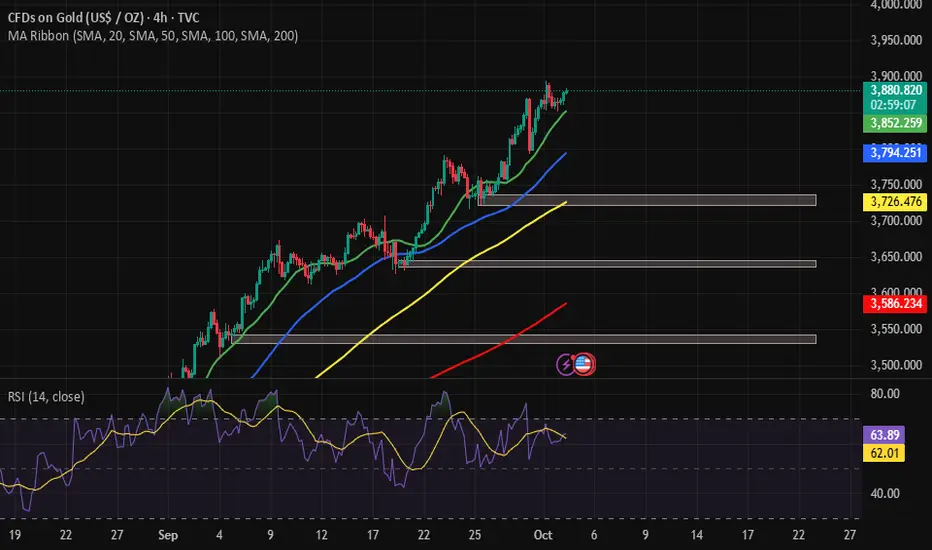
Gold has maintained a remarkable bullish run over the past few weeks, consistently forming higher highs and higher lows. On the 4-hour chart, the structure remains intact with multiple Break of Structure (BOS) confirmations along the way, highlighting the strength of the ongoing uptrend.
At the time of writing, price is hovering around $3,880, just beneath a recently marked weak high. This position is critical because it represents a zone where liquidity is likely sitting, and traders will be closely monitoring whether price can sustain above this level or if a retracement unfolds first.
The prevailing bullish sentiment is further reinforced by the alignment of moving averages. The short-term exponential moving averages are comfortably above the medium- and long-term averages, confirming that momentum remains on the buyers’ side.
Key Technical Levels
Immediate Resistance (Weak High Zone): $3,880 – $3,885
Demand Zone 1: $3,794 – $3,800
Demand Zone 2: $3,726 – $3,735
Deeper Support Zone: Around $3,585
These zones are likely to act as reaction points if gold retraces in the short term. A break below $3,726 could open the door to deeper corrections, while sustained buying above $3,880 may trigger further upside momentum.
Price Structure and Liquidity
The consistent BOS patterns indicate that buyers have been in strong control. However, the “weak high” now visible on the chart raises questions. Typically, a weak high suggests that the move lacks conviction or liquidity above that level has not yet been taken out.
In practice, this often leads to price manipulation or a liquidity sweep, where the market briefly spikes above the high to trigger stop-loss orders before a larger move in either direction.
As Justin Grossbard from CompareForexBrokers pointed out:
“When price forms a weak high in a strong trend, it often indicates liquidity above that level, which can be taken out before any real reversal begins.”
This perspective adds weight to the possibility that gold might attempt to push slightly higher to clear out liquidity before experiencing a deeper retracement.
RSI and Momentum Signals
The Relative Strength Index (RSI) currently sits near the 65 level, not yet in extreme overbought territory but certainly closer to the upper range. This suggests that while momentum remains bullish, the risk of short-term exhaustion is present.
If RSI begins to diverge while price continues higher, it could provide an early signal of weakening momentum. Until such divergence occurs, however, traders should remain cautious about prematurely calling a top in this market.
Possible Scenarios
1. Bullish Continuation (Liquidity Grab Above $3,880)
The first scenario sees price pushing beyond the weak high near $3,880–$3,885 to take out liquidity. If buyers manage to sustain above this zone, the bullish trend could extend toward higher targets, potentially reaching the psychological round numbers near $3,900 and beyond.
2. Retracement Into Demand Zones
If price fails to hold above $3,880, the market may retrace into the identified demand zones. The first notable zone sits around $3,794, followed by a stronger support near $3,726. These areas could attract buyers looking for discounted entries in line with the dominant trend.
3. Deeper Correction Toward $3,585
Should momentum weaken further, gold may test the deeper support zone around $3,585. This would represent a more significant correction but would still keep the long-term structure intact, given the strong rally that preceded it.
Broader Market Context
The strong rally in gold reflects not only technical buying but also broader market sentiment. Gold typically benefits during periods of uncertainty, and the current global economic environment has provided ample fuel for safe-haven demand.
At the same time, rising commodity prices and central bank policies remain key drivers. The U.S. dollar’s fluctuations and expectations for interest rates will likely influence the next leg of gold’s movement. Traders should therefore monitor not only technical structures but also fundamental events that can shift momentum quickly.
Strategic Outlook
From a strategic standpoint, the market offers opportunities on both sides depending on price action around the weak high.
For intraday traders: Watching liquidity around $3,880 will be critical. A breakout and retest could provide continuation setups, while rejection may open opportunities for short-term pullbacks.
For swing traders: Demand zones around $3,794 and $3,726 offer potential long entries in line with the broader trend. Risk management remains crucial given the possibility of deeper retracements.
For long-term investors: The overall trend remains bullish, and pullbacks into stronger support areas could be viewed as accumulation opportunities rather than reversal signals.
Conclusion
Gold remains firmly in an uptrend, with bullish structure intact across the 4H timeframe. However, the presence of a weak high at $3,880 introduces the potential for a short-term liquidity grab before any meaningful retracement occurs. Demand zones below offer solid reaction points where buyers may step back in.
As highlighted by Justin Grossbard from CompareForexBrokers, liquidity hunts are common in strong trends and should be considered when evaluating potential breakout or pullback scenarios.
📌 Final Note: Traders should remain patient and disciplined, waiting for clear confirmations around the $3,880 zone or the lower demand areas before committing to new positions. The path of least resistance remains upward, but short-term volatility could provide both risks and opportunities.
Gold has maintained a remarkable bullish run over the past few weeks, consistently forming higher highs and higher lows. On the 4-hour chart, the structure remains intact with multiple Break of Structure (BOS) confirmations along the way, highlighting the strength of the ongoing uptrend.
At the time of writing, price is hovering around $3,880, just beneath a recently marked weak high. This position is critical because it represents a zone where liquidity is likely sitting, and traders will be closely monitoring whether price can sustain above this level or if a retracement unfolds first.
The prevailing bullish sentiment is further reinforced by the alignment of moving averages. The short-term exponential moving averages are comfortably above the medium- and long-term averages, confirming that momentum remains on the buyers’ side.
Key Technical Levels
Immediate Resistance (Weak High Zone): $3,880 – $3,885
Demand Zone 1: $3,794 – $3,800
Demand Zone 2: $3,726 – $3,735
Deeper Support Zone: Around $3,585
These zones are likely to act as reaction points if gold retraces in the short term. A break below $3,726 could open the door to deeper corrections, while sustained buying above $3,880 may trigger further upside momentum.
Price Structure and Liquidity
The consistent BOS patterns indicate that buyers have been in strong control. However, the “weak high” now visible on the chart raises questions. Typically, a weak high suggests that the move lacks conviction or liquidity above that level has not yet been taken out.
In practice, this often leads to price manipulation or a liquidity sweep, where the market briefly spikes above the high to trigger stop-loss orders before a larger move in either direction.
As Justin Grossbard from CompareForexBrokers pointed out:
“When price forms a weak high in a strong trend, it often indicates liquidity above that level, which can be taken out before any real reversal begins.”
This perspective adds weight to the possibility that gold might attempt to push slightly higher to clear out liquidity before experiencing a deeper retracement.
RSI and Momentum Signals
The Relative Strength Index (RSI) currently sits near the 65 level, not yet in extreme overbought territory but certainly closer to the upper range. This suggests that while momentum remains bullish, the risk of short-term exhaustion is present.
If RSI begins to diverge while price continues higher, it could provide an early signal of weakening momentum. Until such divergence occurs, however, traders should remain cautious about prematurely calling a top in this market.
Possible Scenarios
1. Bullish Continuation (Liquidity Grab Above $3,880)
The first scenario sees price pushing beyond the weak high near $3,880–$3,885 to take out liquidity. If buyers manage to sustain above this zone, the bullish trend could extend toward higher targets, potentially reaching the psychological round numbers near $3,900 and beyond.
2. Retracement Into Demand Zones
If price fails to hold above $3,880, the market may retrace into the identified demand zones. The first notable zone sits around $3,794, followed by a stronger support near $3,726. These areas could attract buyers looking for discounted entries in line with the dominant trend.
3. Deeper Correction Toward $3,585
Should momentum weaken further, gold may test the deeper support zone around $3,585. This would represent a more significant correction but would still keep the long-term structure intact, given the strong rally that preceded it.
Broader Market Context
The strong rally in gold reflects not only technical buying but also broader market sentiment. Gold typically benefits during periods of uncertainty, and the current global economic environment has provided ample fuel for safe-haven demand.
At the same time, rising commodity prices and central bank policies remain key drivers. The U.S. dollar’s fluctuations and expectations for interest rates will likely influence the next leg of gold’s movement. Traders should therefore monitor not only technical structures but also fundamental events that can shift momentum quickly.
Strategic Outlook
From a strategic standpoint, the market offers opportunities on both sides depending on price action around the weak high.
For intraday traders: Watching liquidity around $3,880 will be critical. A breakout and retest could provide continuation setups, while rejection may open opportunities for short-term pullbacks.
For swing traders: Demand zones around $3,794 and $3,726 offer potential long entries in line with the broader trend. Risk management remains crucial given the possibility of deeper retracements.
For long-term investors: The overall trend remains bullish, and pullbacks into stronger support areas could be viewed as accumulation opportunities rather than reversal signals.
Conclusion
Gold remains firmly in an uptrend, with bullish structure intact across the 4H timeframe. However, the presence of a weak high at $3,880 introduces the potential for a short-term liquidity grab before any meaningful retracement occurs. Demand zones below offer solid reaction points where buyers may step back in.
As highlighted by Justin Grossbard from CompareForexBrokers, liquidity hunts are common in strong trends and should be considered when evaluating potential breakout or pullback scenarios.
📌 Final Note: Traders should remain patient and disciplined, waiting for clear confirmations around the $3,880 zone or the lower demand areas before committing to new positions. The path of least resistance remains upward, but short-term volatility could provide both risks and opportunities.

คำจำกัดสิทธิ์ความรับผิดชอบ
ข้อมูลและบทความไม่ได้มีวัตถุประสงค์เพื่อก่อให้เกิดกิจกรรมทางการเงิน, การลงทุน, การซื้อขาย, ข้อเสนอแนะ หรือคำแนะนำประเภทอื่น ๆ ที่ให้หรือรับรองโดย TradingView อ่านเพิ่มเติมใน ข้อกำหนดการใช้งาน
คำจำกัดสิทธิ์ความรับผิดชอบ
ข้อมูลและบทความไม่ได้มีวัตถุประสงค์เพื่อก่อให้เกิดกิจกรรมทางการเงิน, การลงทุน, การซื้อขาย, ข้อเสนอแนะ หรือคำแนะนำประเภทอื่น ๆ ที่ให้หรือรับรองโดย TradingView อ่านเพิ่มเติมใน ข้อกำหนดการใช้งาน